Loading...
Pubblicazioni Scientifiche
Filtri di ricerca 3 risultati
Pubblicazioni per anno
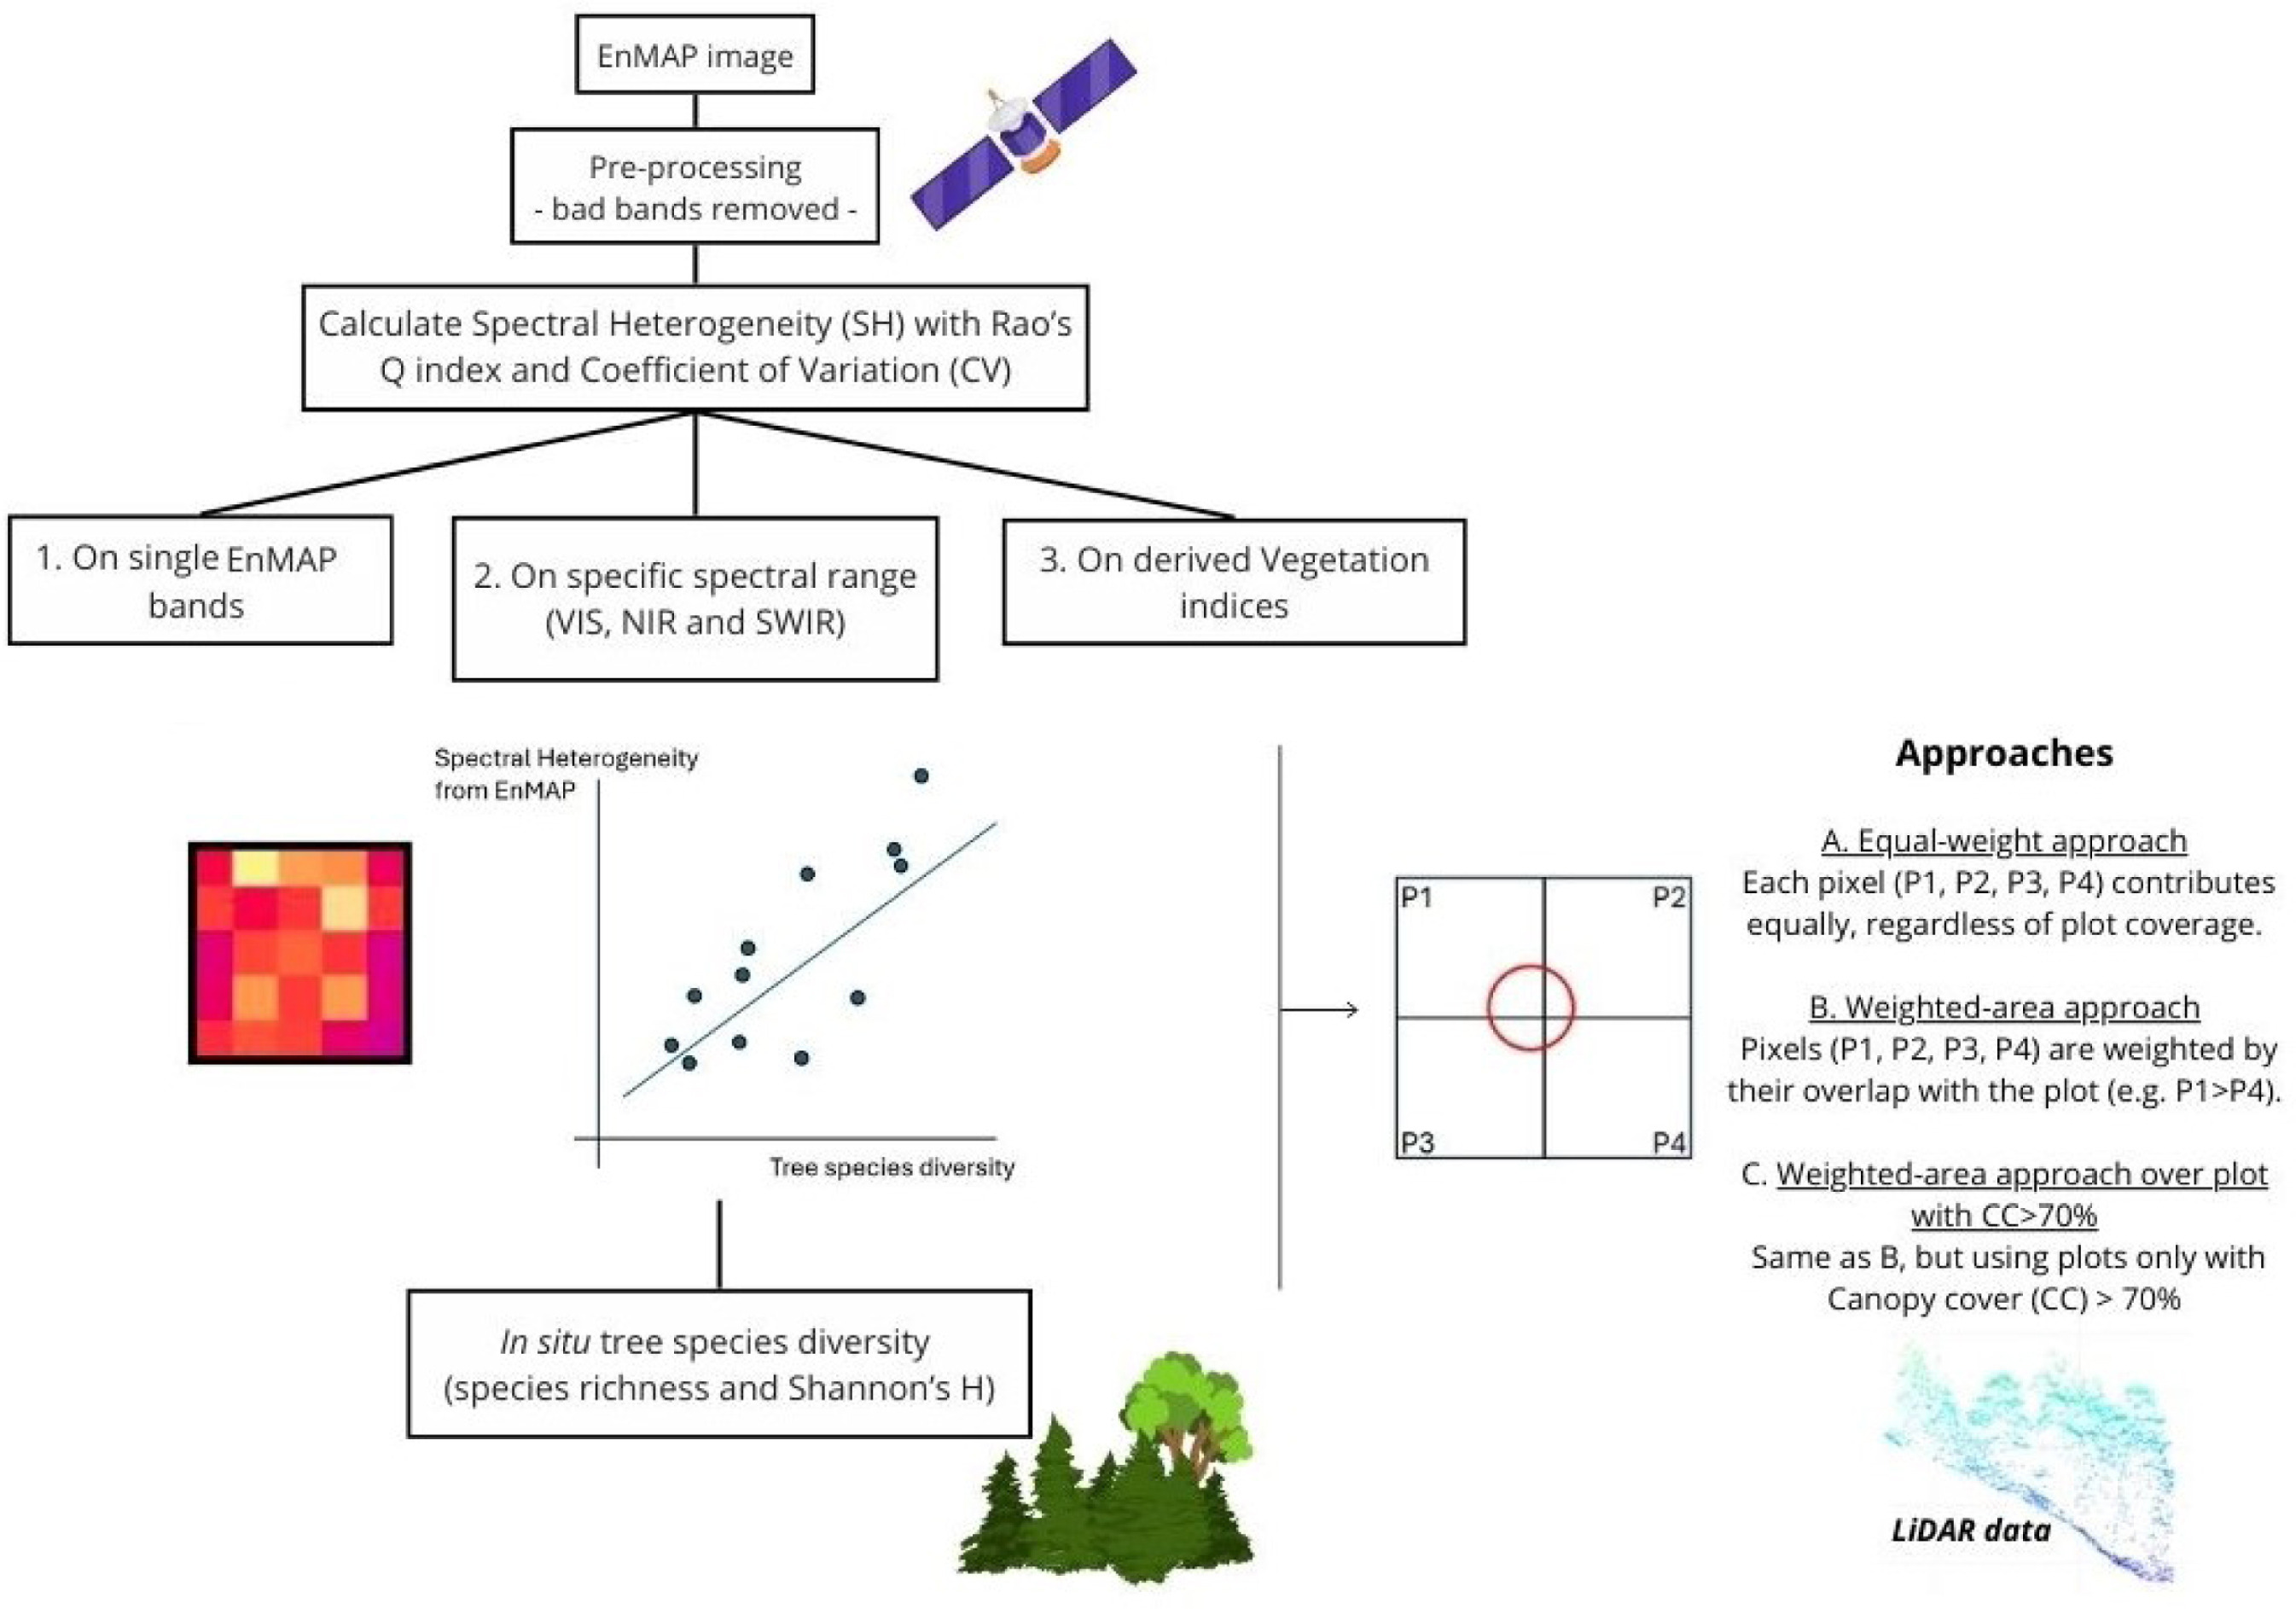
Spectral heterogeneity from the spaceborne imaging spectrometer EnMAP reveals biodiversity patterns in forest ecosystems
Torresani
,
Michele
,
Rossi
,
Christian
,
Mina
,
Marco
,
Menegaldo
,
Irene
,
Cappuccio
,
Matteo
,
Perrone
,
Michela
,
Hakkenberg
,
Christopher R.
,
Rocchini
,
Duccio
,
Puletti
,
Nicola
,
Stendardi
,
Laura
,
Montagnani
,
Leonardo
,
Tognetti
,
Roberto
Mostra abstract
The Spectral Variation Hypothesis (SVH) proposes that spectral heterogeneity (SH), derived from optical data, can serve as a proxy for estimating biodiversity. In this study, we tested the SVH across 42 forest plots in the Italian Alps using imaging spectroscopy data from the EnMAP satellite. We investigated the relationship between SH—quantified using two different metrics, Rao's Q and the coefficient of variation (CV)—and tree species diversity (using Shannon's H index and species richness). We applied three levels of spectral analysis: (1) SH calculated for each individual EnMAP band; (2) SH aggregated across broader spectral ranges (Visible -VIS-, Near Infrared -NIR-, and Shortwave Infrared -SWIR-) and (3) SH derived from vegetation indices (VIs). These analyses were performed under three spatial approaches: (A) a normal approach assigning equal weight to all four EnMAP pixels intersecting a plot; (B) a weighted approach based on the proportional overlap of each pixel with the plot area; and (C) a weighted canopy cover (CC)>70% approach, which included only plots with CC greater than 70% as derived from airborne laser scanning (ALS) LiDAR data. Weak to moderate correlations were observed when SH was derived from single bands, with the strongest relationships in the NIR (R<sup>2</sup> approaching 0.4), followed by the VIS and SWIR regions. A similar trend emerged when SH was aggregated across broader spectral ranges, with the highest correlations again found in the NIR (R<sup>2</sup> up to 0.35). In contrast, lower R<sup>2</sup> values were obtained when SH was computed from specific VIs. The weighted approaches, especially when restricted to plots with CC >70%, consistently yielded higher R<sup>2</sup> values than the equal-weight approach in all three the spectral analysis. Results were consistent across both SH metrics (Rao's Q and CV), with stronger correlations when species richness was used as the biodiversity metric. This work highlights how EnMAP hyperspectral data, despite inherent constraints, can provide valuable insights into forest biodiversity monitoring. © 2025 The Author(s)

Mapping Understory Vegetation Density in Mediterranean Forests: Insights from Airborne and Terrestrial Laser Scanning Integration
forest biodiversity
lidar
terrestrial laser scanner
forest structure
spatial prediction
voxelization
Mostra abstract
The understory is an essential ecological and structural component of forest ecosystems. The lack of efficient, accurate, and objective methods for evaluating and quantifying the spatial spread of understory characteristics over large areas is a challenge for forest planning and management, with specific regard to biodiversity and habitat governance. In this study, we used terrestrial and airborne laser scanning (TLS and ALS) data to characterize understory in a European beech and black pine forest in Italy. First, we linked understory structural features derived from traditional field measurements with TLS metrics, then, we related such metrics to the ones derived from ALS. Results indicate that (i) the upper understory density (5–10 m above ground) is significantly associated with two ALS metrics, specifically the mean height of points belonging to the lower third of the ALS point cloud within the voxel (HM<inf>1/3</inf>) and the corresponding standard deviation (SD<inf>1/3</inf>), while (ii) for the lower understory layer (2–5 m above ground), the most related metric is HM<inf>1/3</inf> alone. As an example application, we have produced a map of forest understory for each layer, extending over the entire study region covered by ALS data, based on the developed spatial prediction models. With this study, we also demonstrated the power of hand-held mobile-TLS as a fast and high-resolution tool for measuring forest structural attributes and obtaining relevant ecological data. © 2023 by the authors.
Characterizing subcanopy structure of Mediterranean forests by terrestrial laser scanning data
forest biodiversity
lidar
terrestrial laser scanner
forest structure
spatial prediction
voxelization
Mostra abstract
Vegetation structure is one of the key factors in forest ecosystems. Especially understory structure has major implications for wildlife habitat selection, reproduction, and survival. Structural indices traditionally used to characterize understory vegetation are based on field vegetation surveys describing general features such as leaf area index (LAI), canopy cover or vegetation height, hiding much of the three-dimensional vegetation structure complexity. The application of terrestrial laser scanning (TLS) in forest ecological and management applications is becoming more effective. In this study, we use TLS data to quantify spatial attributes of forest subcanopy in four different forest strata ranging from 0.5 m to 10 m from the ground. We collected data in 12 plots of mature European beech (Fagus sylvatica L.) forests and 12 plots of mature black pine (Pinus nigra subsp. laricio Maire) forests, located in the Sila National Park, Italy. We propose a TLS-based approach to estimate a fine-scale vegetation density using the Plant Density Index (PDI) and to test the PDI at different height classes. We found a significant relationship between the PDI and the number of trees belonging to the dominant layer, using the Spearman correlation coefficient (r = 0.83, p<inf>val</inf> = 0.001). Basing on PDI values, a cluster analysis of the four subcanopy strata was carried out for deriving clusters of structurally homogeneous forest plots. Results identified three clusters in terms of the vegetation features in the horizontal height classes: the first cluster primarily includes Beech forests characterized by plots with the highest tree densities; the second one includes both Beech and Pine forests characterized by dense ground vegetation and shrubs and an intermediate tree density; the third group is represented by Pine forests with massive presence of vegetation lower strata and moderate tree density. Then, PCA allowed identifying the relationship between the considered subcanopy layers and forest plots. © 2021 Elsevier B.V.