Loading...
Pubblicazioni Scientifiche
Filtri di ricerca 71 risultati
Pubblicazioni per anno
Forest structure and understory functional diversity at multiple scales: The importance of median tree height
de Benedictis
,
Luciano Ludovico Maria
,
Chelli
,
Stefano
,
Zhu
,
Zhengxue
,
Cervellini
,
Marco
,
Canullo
,
R.
,
Chianucci
,
Francesco
,
Puletti
,
Nicola
,
Tsakalos
,
James L.
,
Bartha
,
Sándor
,
Campetella
,
Giandiego
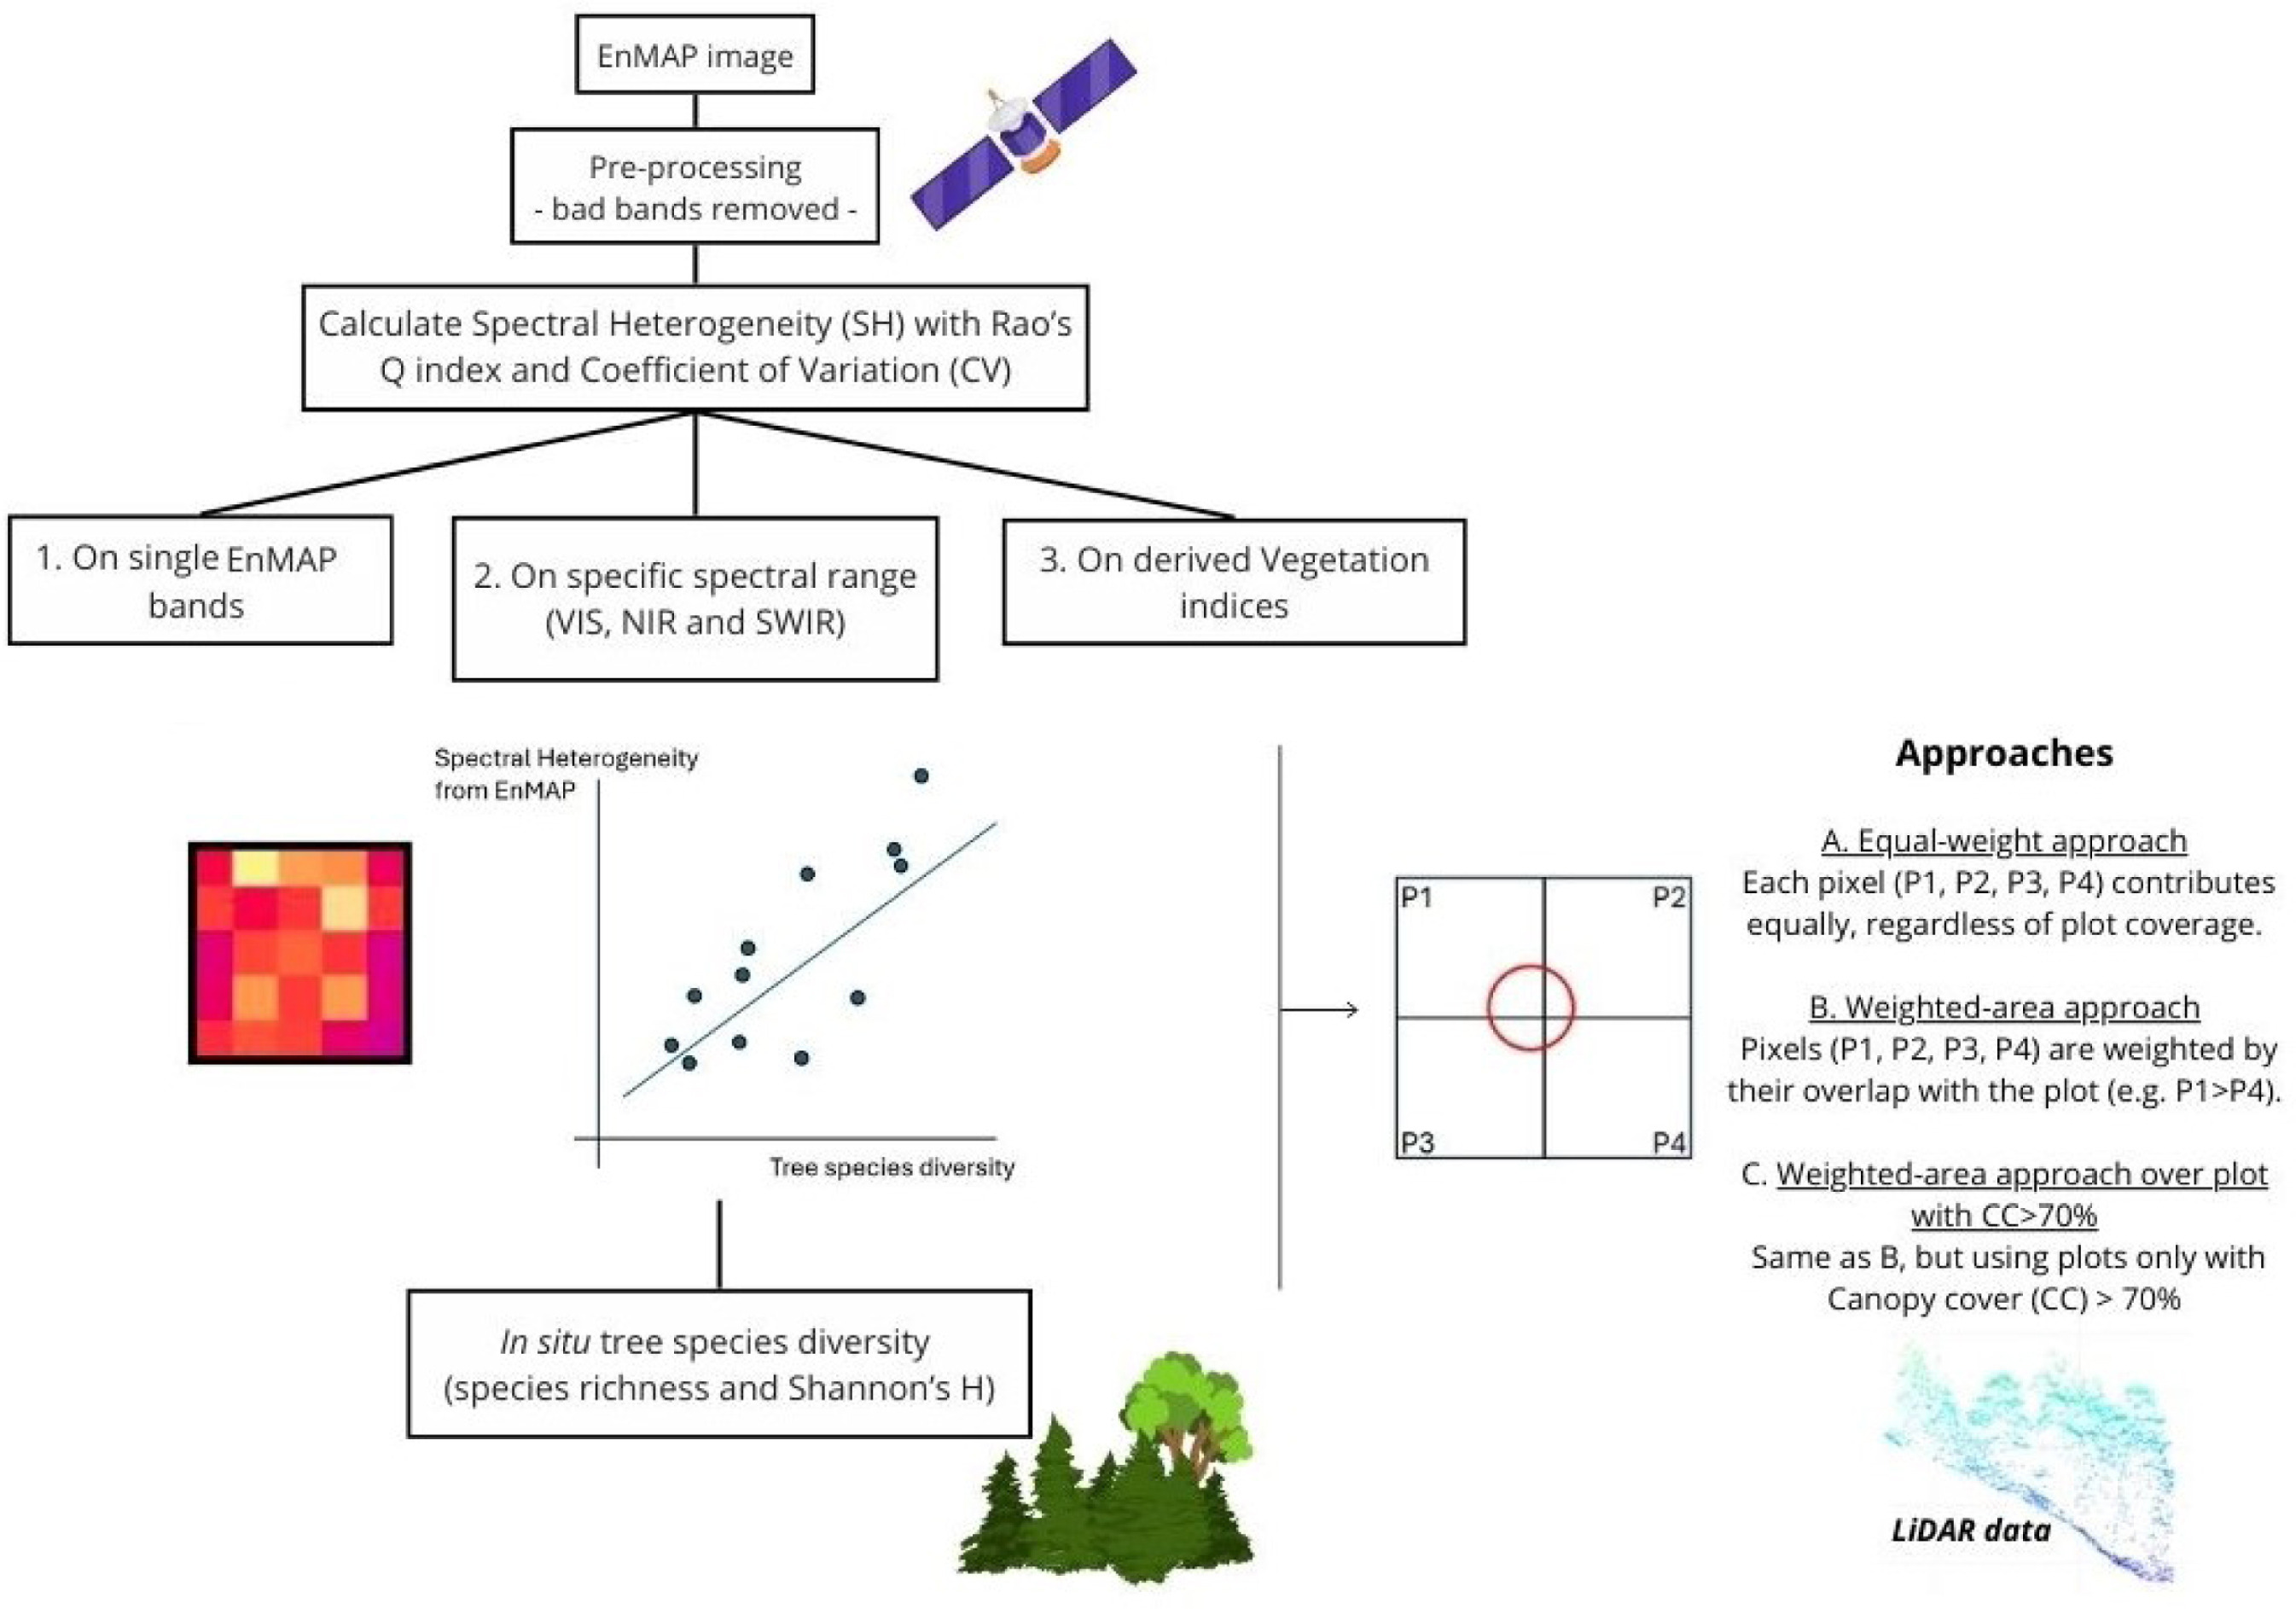
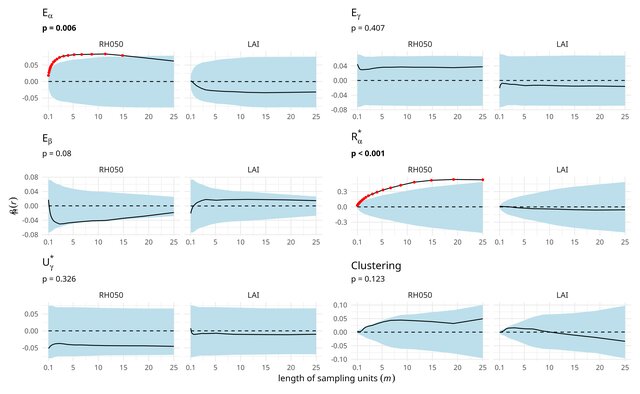
Spectral heterogeneity from the spaceborne imaging spectrometer EnMAP reveals biodiversity patterns in forest ecosystems
Torresani
,
Michele
,
Rossi
,
Christian
,
Mina
,
Marco
,
Menegaldo
,
Irene
,
Cappuccio
,
Matteo
,
Perrone
,
Michela
,
Hakkenberg
,
Christopher R.
,
Rocchini
,
Duccio
,
Puletti
,
Nicola
,
Stendardi
,
Laura
,
Montagnani
,
Leonardo
,
Tognetti
,
Roberto
Mostra abstract
The Spectral Variation Hypothesis (SVH) proposes that spectral heterogeneity (SH), derived from optical data, can serve as a proxy for estimating biodiversity. In this study, we tested the SVH across 42 forest plots in the Italian Alps using imaging spectroscopy data from the EnMAP satellite. We investigated the relationship between SH—quantified using two different metrics, Rao's Q and the coefficient of variation (CV)—and tree species diversity (using Shannon's H index and species richness). We applied three levels of spectral analysis: (1) SH calculated for each individual EnMAP band; (2) SH aggregated across broader spectral ranges (Visible -VIS-, Near Infrared -NIR-, and Shortwave Infrared -SWIR-) and (3) SH derived from vegetation indices (VIs). These analyses were performed under three spatial approaches: (A) a normal approach assigning equal weight to all four EnMAP pixels intersecting a plot; (B) a weighted approach based on the proportional overlap of each pixel with the plot area; and (C) a weighted canopy cover (CC)>70% approach, which included only plots with CC greater than 70% as derived from airborne laser scanning (ALS) LiDAR data. Weak to moderate correlations were observed when SH was derived from single bands, with the strongest relationships in the NIR (R<sup>2</sup> approaching 0.4), followed by the VIS and SWIR regions. A similar trend emerged when SH was aggregated across broader spectral ranges, with the highest correlations again found in the NIR (R<sup>2</sup> up to 0.35). In contrast, lower R<sup>2</sup> values were obtained when SH was computed from specific VIs. The weighted approaches, especially when restricted to plots with CC >70%, consistently yielded higher R<sup>2</sup> values than the equal-weight approach in all three the spectral analysis. Results were consistent across both SH metrics (Rao's Q and CV), with stronger correlations when species richness was used as the biodiversity metric. This work highlights how EnMAP hyperspectral data, despite inherent constraints, can provide valuable insights into forest biodiversity monitoring. © 2025 The Author(s)
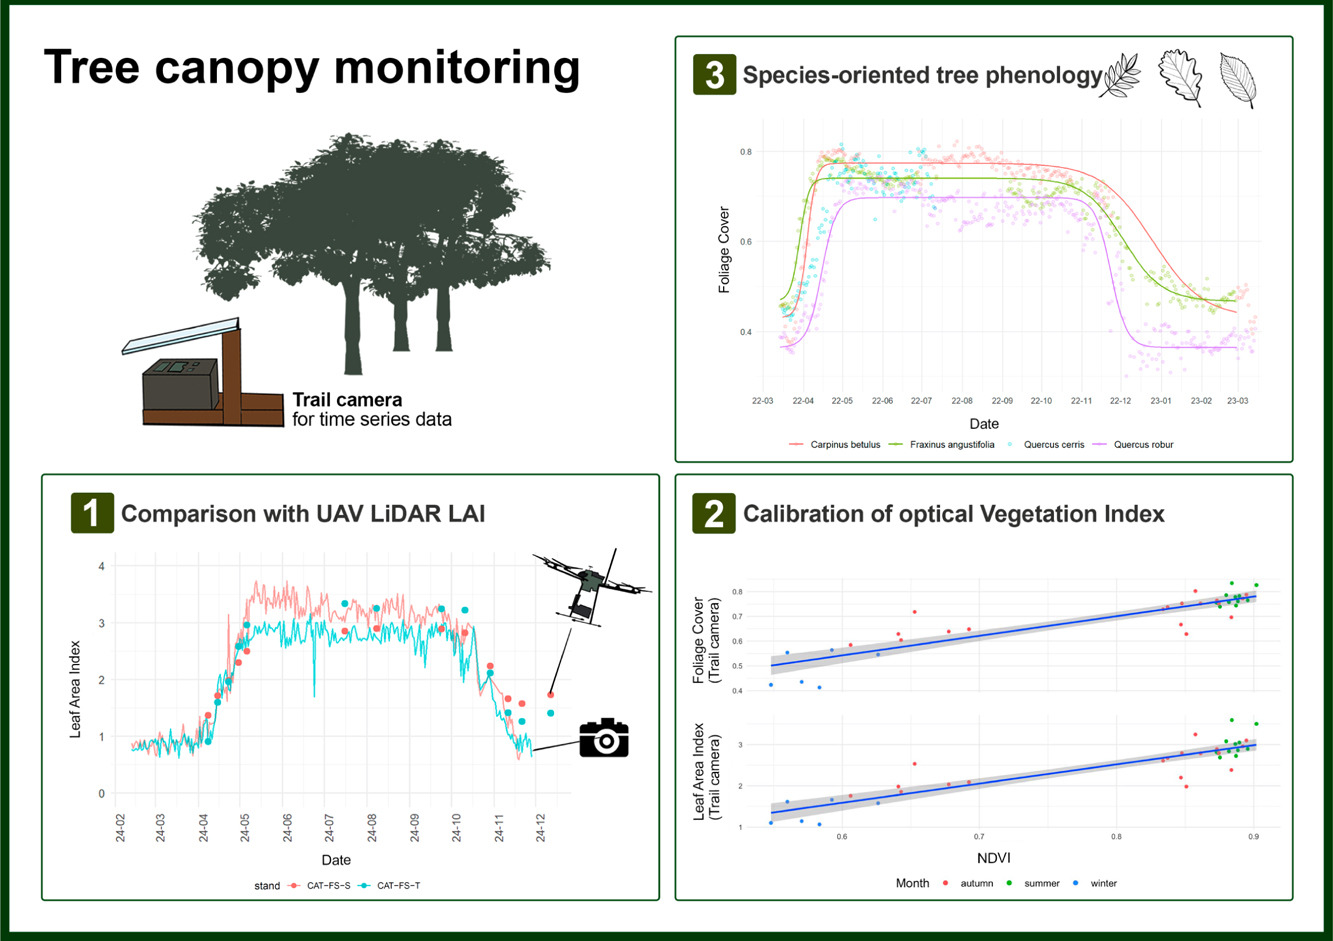
CrowNet: a trail-camera canopy monitoring system
Chianucci
,
Francesco
,
Lenzi
,
Alice
,
Minari
,
Emma
,
Guasti
,
Matteo
,
Gisondi
,
Silvia
,
Gonnelli
,
Marco
,
Innocenti
,
Simone
,
Ferrara
,
Carlotta
,
Campanaro
,
Alessandro
,
Ciampelli
,
Paola
,
Cutini
,
Andrea
,
Puletti
,
Nicola
Mostra abstract
Continuous monitoring of forest canopy structure and phenology is pivotal for the assessment of ecosystem responses to environmental variability and changes. The present study evaluated the use of repeat digital trail cameras as a low-cost, flexible, and accessible in situ monitoring solution for quantifying daily canopy attributes, including effective leaf area index (Le) and canopy cover. A trial camera monitoring network (CrowNet) was established encompassing 20 forest stands in Italy, under different management and environmental conditions, resulting in over 44,000 daily images collected over three years. We demonstrated that taking the mean daily canopy attribute allowed to obtain smooth time series from trail cameras, from which phenological transition dates can be inferred. Daily canopy attributes were validated against manual digital cover photography measurement. To further explore the applicability of this monitoring solution, we performed a comparison between daily Le time series derived from a subset of trail cameras located in beech forests and data collected by multitemporal UAV LiDAR. Results demonstrated the close agreement between the two methods across the entire phenological period (start and end of season). We also illustrated use of continuous trail camera estimates to calibrate a vegetation index (NDVI) to infer leaf area and canopy cover from optical multi-temporal UAV data. We further investigated use of trail camera to detect species-specific differences in tree phenology from time series acquired in a mixed oak-hornbeam forest. We found different canopy structure and phenological transition dates in three broadleaved species (oak, ash, hornbeam), supporting the effectiveness of trail cameras for species-oriented phenology monitoring. We conclude that trail cameras provide a reliable solution for daily canopy monitoring, offering a significant cost-effective and flexible alternative to traditional field methods and providing potential to calibrate, validate or integrate remotely-sensed information. However, camera failures during adverse weather, and the need for more efficient image data quality checking procedures, still represent open challenges. Future improvements, such as weatherproof housing and automated pre-processing screening procedures, are therefore recommended for making trail camera fully operational in ground canopy and phenology monitoring. © 2025 Elsevier B.V.
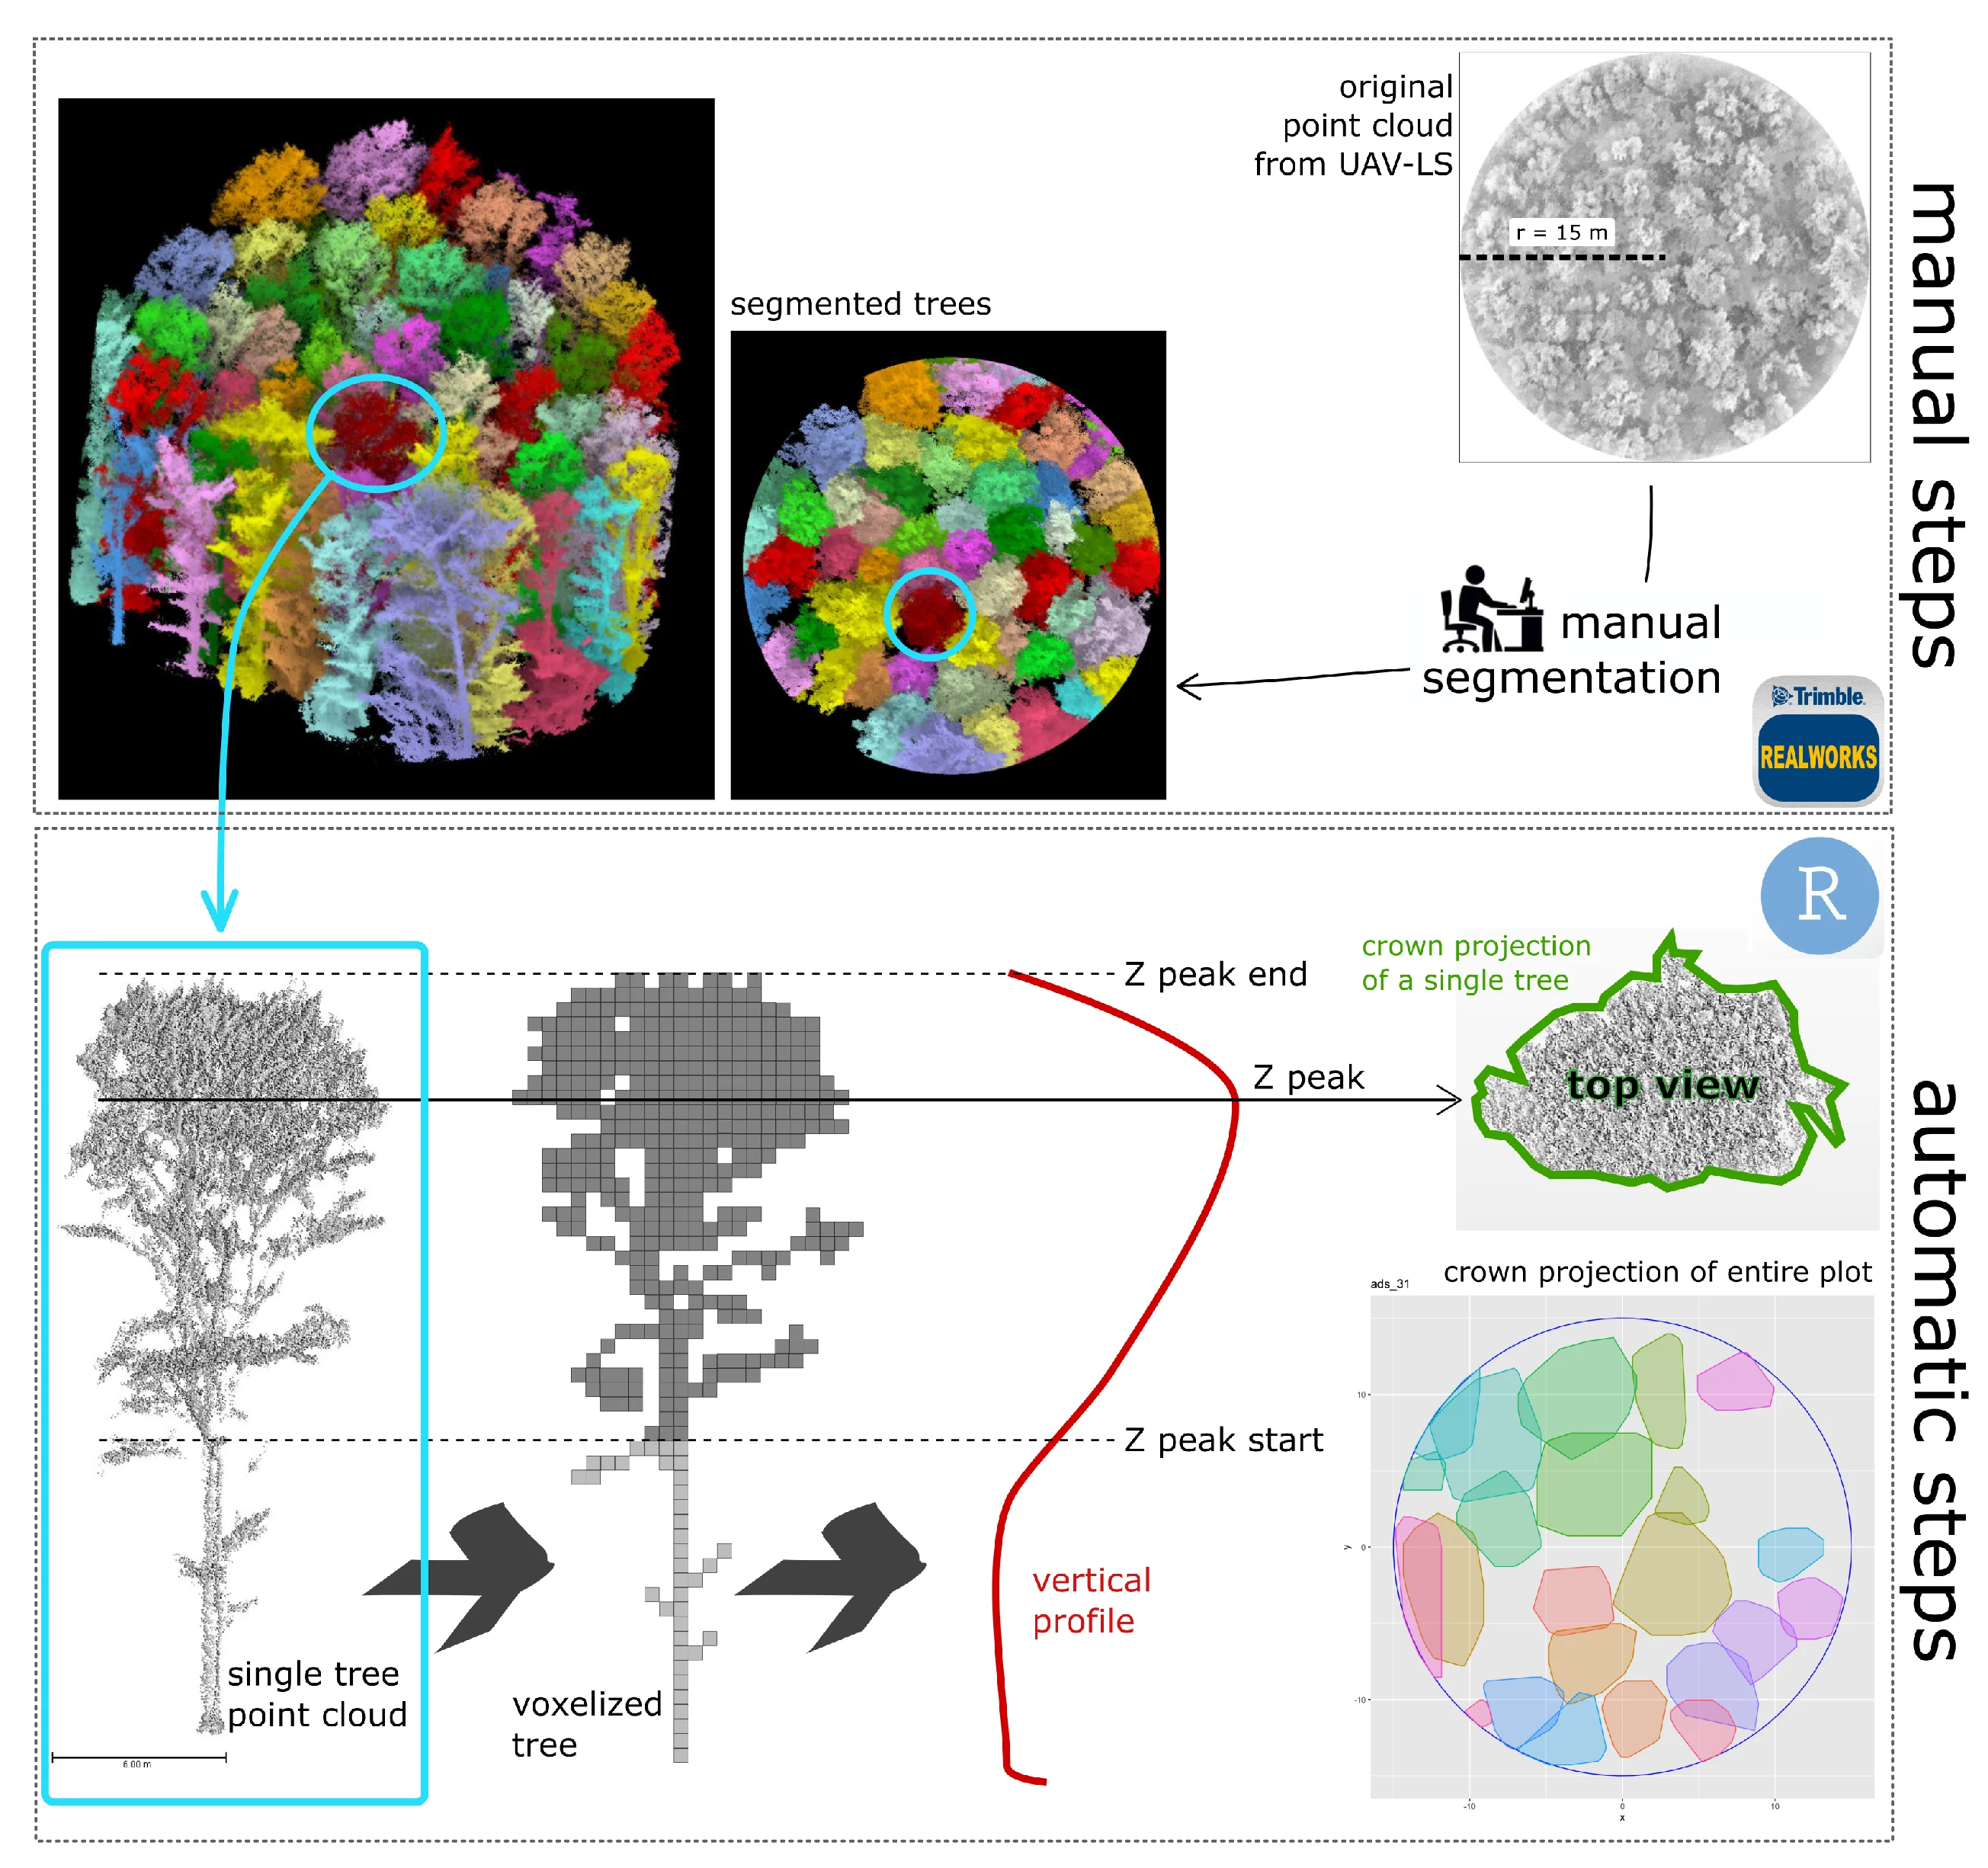
A Semi-Automatic Approach for Tree Crown Competition Indices Assessment from UAV LiDAR
beech forests
individual tree segmentation
precision forestry
size differation index
vertical profile traits
Mostra abstract
Understanding the spatial heterogeneity of forest structure is crucial for comprehending ecosystem dynamics and promoting sustainable forest management. Unmanned aerial vehicle (UAV) LiDAR technology provides a promising method to capture detailed three-dimensional (3D) information about forest canopies, aiding in management and silvicultural practices. This study investigates the heterogeneity of forest structure in broadleaf forests using UAV LiDAR data, with a particular focus on tree crown features and their different information content compared to diameters. We explored a non-conventionally used method that emphasizes crown competition by employing a nearest neighbor selection technique based on metrics derived from UAV point cloud profiles at the tree level, rather than traditional DBH (diameter at breast height) spatial arrangement. About 300 vegetation elements within 10 plots collected in a managed Beech forest were used as reference data. We demonstrate that crown-based approaches, which are feasible with UAV LiDAR data at a reasonable cost and time, significantly enhances the understanding of forest heterogeneity, adding new information content for managers. Our findings underscore the utility of UAV LiDAR in characterizing the complexity and variability of forest structure at high resolution, offering valuable insights for carbon accounting and sustainable forest management. © 2024 by the authors.

Improving Aboveground Biomass Estimation in Beech Forests with 3D Tree Crown Parameters Derived from UAV-LS
Mostra abstract
Accurate estimates of aboveground biomass (AGB) are essential for forest policies to reduce carbon emissions. Unmanned aerial laser scanning (UAV-LS) offers unprecedented millimetric detail but is underutilized in monitoring broadleaf Mediterranean forests compared to coniferous ones. This study aims to design and evaluate a procedure for AGB estimates based on the predictive power of crown features. In the first step, we manually created Quantitative Structure Models (QSMs) for 320 trees using data from UAV laser scanning (UAV-LS), airborne laser scanning (ALS), and co-registered terrestrial laser scanning (TLS). This provided the most accurate non-destructive estimate of aboveground biomass (AGB) in the absence of destructive measurements. For each reference tree we also measured crown projection and crown volume to build two separated models relating AGB to such crown features. In the second phase, we evaluated the potential of UAV-LS for quantifying AGB in a pure European beech (Fagus sylvatica) forest and compared it with traditional ALS estimates, using fully automatic procedures. The two obtained tree-level AGB models were then tested using three datasets derived from 35 sampling plots over the same study area: (a) 1130 trees manually segmented (phase-2 reference); (b) trees automatically extracted from ALS data; and (c) trees automatically extracted from UAV-LS data. Results demonstrate that detailed UAV-LS data improve model sensitivity compared to ALS data (RMSE = 45.6 Mg ha<sup>−1</sup>, RMSE% = 13.4%, R2 = 0.65, for the best ALS model; RMSE = 44.0 Mg ha<sup>−1</sup>, RMSE% = 12.9%, R2 = 0.67, for the best UAV-LS model), allowing for the detection of AGB differences even in quite homogenous forest structures. Overall, this study demonstrates the combined use of both laser scanner data can foster non-destructive and more precise AGB estimation than the use of only one, in forested areas across hectare scales (1 to 100 ha). © 2025 by the authors.
Benchmarking tree species classification from proximally sensed laser scanning data: Introducing the FOR-species20K dataset
Puliti
,
Stefano
,
Lines
,
Emily R.
,
Müllerová
,
Jana
,
Frey
,
Julian
,
Schindler
,
Zoe
,
Straker
,
Adrian
,
Allen
,
Matthew J.
,
Winiwarter
,
Lukas
,
Rehush
,
Nataliia
,
Hristova
,
Hristina S.
,
Murray
,
Brent A.
,
Calders
,
Kim
,
Coops
,
Nicholas C.
,
Höfle
,
Bernhard
,
Irwin
,
Liam A.K.
,
Junttila
,
Samuli
,
Kruček
,
Martin
,
Krok
,
G.
,
Král
,
Kamil
,
Levick
,
Shaun R.
,
Lück
,
Linda
,
Missarov
,
Azim
,
Mokroš
,
M.
,
Owen
,
Harry Jon Foord
,
Stereńczak
,
Krzysztof Jan
,
Pitkänen
,
Timo P.
,
Puletti
,
Nicola
,
Saarinen
,
Ninni
,
Hopkinson
,
Chris Dennis
,
Terryn
,
Louise
,
Torresan
,
C.
,
Tomelleri
,
Enrico
,
Weiser
,
Hannah
,
Astrup
,
Rasmus
Mostra abstract
Proximally sensed laser scanning presents new opportunities for automated forest ecosystem data capture. However, a gap remains in deriving ecologically pertinent information, such as tree species, without additional ground data. Artificial intelligence approaches, particularly deep learning (DL), have shown promise towards automation. Progress has been limited by the lack of large, diverse, and, most importantly, openly available labelled single-tree point cloud datasets. This has hindered both (1) the robustness of the DL models across varying data types (platforms and sensors) and (2) the ability to effectively track progress, thereby slowing the convergence towards best practice for species classification. To address the above limitations, we compiled the FOR-species20K benchmark dataset, consisting of individual tree point clouds captured using proximally sensed laser scanning data from terrestrial (TLS), mobile (MLS) and drone laser scanning (ULS). Compiled collaboratively, the dataset includes data collected in forests mainly across Europe, covering Mediterranean, temperate and boreal biogeographic regions. It includes scattered tree data from other continents, totaling over 20,000 trees of 33 species and covering a wide range of tree sizes and forms. Alongside the release of FOR-species20K, we benchmarked seven leading DL models for individual tree species classification, including both point cloud (PointNet++, MinkNet, MLP-Mixer, DGCNNs) and multi-view 2D-based methods (SimpleView, DetailView, YOLOv5). 2D Image-based models had, on average, higher overall accuracy (0.77) than 3D point cloud-based models (0.72). Notably, the performance was consistently >0.8 across scanning platforms and sensors, offering versatility in deployment. The top-scoring model, DetailView, demonstrated robustness to training data imbalances and effectively generalized across tree sizes. The FOR-species20K dataset represents an important asset for developing and benchmarking DL models for individual tree species classification using proximally sensed laser scanning data. As such, it serves as a crucial foundation for future efforts to classify accurately and map tree species at various scales using laser scanning technology, as it provides the complete code base, dataset, and an initial baseline representative of the current state-of-the-art of point cloud tree species classification methods. © 2025 The Author(s). Methods in Ecology and Evolution published by John Wiley & Sons Ltd on behalf of British Ecological Society.
LAIr: an R package to estimate LAI from Normalized Difference Vegetation Index
Bajocco
,
Sofia
,
Ferrara
,
Carlotta
,
Savian
,
Francesco
,
Ginaldi
,
Fabrizio
,
Puletti
,
Nicola
,
Crecco
,
Lorenzo
,
Bregaglio
,
Simone Ugo Maria
,
Chianucci
,
Francesco
Mostra abstract
Leaf area index (LAI) is an important biophysical parameter describing vegetation. LAI is typically retrieved from optical remote sensing by empirical models relating LAI to vegetation indices, such as the Normalized Difference Vegetation Index (NDVI). As the relationship between LAI and NDVI is non-linear and crop type dependant, several specific empirical equations relating LAI to NDVI have been developed using field data. This study presented LAIr, an R package to derive LAI from NDVI data from the most comprehensive library of conversion equations. In the package, the range of functions differs on environmental factors, sensors, and vegetation types, allowing flexibility in choosing appropriate options based on specific application, scale of investigation and data availability. We illustrated the use of the package with a case study to compare a generic LAI product with specific NDVI-based LAI estimations. By leveraging empirical knowledge, LAIr enables accurate and context-specific estimation of LAI. The deployment of an open-source R package serves as a valuable tool for aiding researchers in selecting the most appropriate equations for conducting NDVI-to-LAI conversion. © 2024
Comparative analysis of taper models for Pinus nigra Arn. using terrestrial laser scanner acquired data
Boukhris
,
Issam
,
Puletti
,
Nicola
,
Vonderach
,
Christian
,
Guasti
,
Matteo
,
Lahssini
,
Said
,
Santini
,
Monia
,
Valentini
,
Riccardo
forest mensuration
b-splines
environmental management
forest as-sessment
max and burkhart
random forest
taper equations
tls
volume equations
Mostra abstract
Taper equations are indispensable tools for characterizing the stem profile of trees, providing valuable insights for forest management, timber inventory, and optimal assortments allocation. The recent progress in Terrestrial Laser Scanning (TLS) has revolutionized forest inventory practices by enabling non-destructive data collection. In this study, four taper models from three different model categories were established based on point cloud data of 219 Pinus nigra trees. The taper equations fitted with TLS data were used to predict the diameter at specific stem heights and the total stem volume. The results show that among fitted models, the Max and Burkhart segmented model calibrated by the means of a mixed-effects approach provided the best estimate of the diameter at different heights and the total stem volume evaluated for different diameter at breast height (DBH) classes. In numerical terms, this model es-timated the diameter and the volume with a respective overall error of 0.781 cm and 0.021 m<sup>3</sup>. The predicted profile also shows that above a relative height of 0.7, the diameter error tends to increase due to the low reliability of data collected beyond the base of the crown primarily caused by interference from branches and leaves. Nevertheless, this study shows that TLS technology presents a compelling opportunity and a promising non-destructive alternative for generating taper profiles and estimating tree volume. © SISEF.
Estimating canopy and stand structure in hybrid poplar plantations from multispectral UAV imagery
Romano
,
Elio
,
Brambilla
,
Massimo
,
Chianucci
,
Francesco
,
Tattoni
,
Clara
,
Puletti
,
Nicola
,
Chirici
,
Gherardo
,
Travaglini
,
Davide
,
Giannetti
,
Francesca
canopy photography
canopy structure
poplar plantation
texture metrics
digital camera
gclm metrics
unmanned aerial vehicle
Mostra abstract
Accurate estimates of canopy structure like canopy cover (CC), Leaf Area Index (LAI), crown volume (Vcr), as well as tree and stand structure like stem volume (V_st) and basal area (G), are considered essential measures to manage poplar plantations effectively as they are correlated with the growth rate and the detection of possible stress. This research exploits the possibility of developing a precision forestry application using an unmanned aerial vehicle (UAV), terrestrial digital camera and traditional field measurements to monitor poplar plantation variables. We set up the procedure using explanatory variables from the Grey Level Co-occurrence Matrix textural metrics (Entropy, Variance, Dissimilarity and Contrast) calculated based on UAV multispectral imagery. Our results show that the GCLM texture derived by multispectral ortomosaic provides adequate explanatory variables to predict poplar plantation characteristics related to plants' canopy and stand structure. The evaluation of the models targeting the different poplar plantation variables (i.e. Vcr, G_ha, Vst_ha, CC and LAI) with the four GLCM explanatory variables (i.e. Entropy, Variance, Dissimilarity and Contrast) consistently higher or equal resulted to R<sup>2</sup> ≥0.86. © 2024, Editura Silvica. All rights reserved.
Moths in space: The below-canopy structure of forest drives abundance and mobility-related traits of moth communities
La Cava
,
Sara
,
Rijllo
,
Giuseppe
,
Zucco
,
Giada
,
Innocenti
,
Simone
,
Guasti
,
Matteo
,
Puletti
,
Nicola
,
Ferrara
,
Carlotta
,
Scalercio
,
S.
Mostra abstract
The distribution of species is primarily driven by the availability of trophic resources. In a given forest type, insects trophically related to the dominant tree are expected to be evenly distributed due to the abundance of their foodplant. However, their distribution is also influenced by complex relationships with abiotic and biotic parameters such as available space, predatory pressure, and morphometric traits. In this study, we investigated how the three-dimensional structure of space below the canopy may affect the composition of nocturnal lepidoptera communities. To synthesise the complexity of the dispersal behaviour of these insects, we evaluated easily measurable traits such as wingspan and the presence of tympanic organs, both connected to their mobility and thus potentially influenced by the structure of the available flight space. The study was conducted in the Sila National Park (Italy), where 12 sampling sites were selected in pine forests and an additional 12 in beech forests. Forest spatial structure was investigated using a portable terrestrial laser scanner. Moths were sampled monthly using light traps from May to October in both 2019 and 2020. Among measured forest traits, we observed that the space above three meters from the ground is the only factor influencing community composition. Larger species with tympanic organs prefer environments with less space below tree canopies. Our findings could be the starting point for future studies that investigate a potential defence strategy of moths against bats, as tympanate and larger species not only actively avoid chiropter predation but could also choose denser forests because of a lower bat activity. Moths' distribution and community composition thus appear to be significantly shaped by the spatial structure of forests. © 2024 Elsevier B.V.
Multiple drivers of functional diversity in temperate forest understories: Climate, soil, and forest structure effects
Chelli
,
Stefano
,
Bricca
,
Alessandro
,
Tsakalos
,
James L.
,
Andreetta
,
Anna
,
Bonari
,
Gianmaria
,
Campetella
,
Giandiego
,
Carnicelli
,
Stefano
,
Cervellini
,
Marco
,
Puletti
,
Nicola
,
Wellstein
,
Camilla
,
Canullo
,
R.
climate change
functional diversity
bud bank
forest management
plant height
seed mass
specific leaf area
Mostra abstract
In macroecology, shifting from coarse- to local-scale explanatory factors is crucial for understanding how global change impacts functional diversity (FD). Plants possess diverse traits allowing them to differentially respond across a spectrum of environmental conditions. We aim to assess how macro- to microclimate, stand-scale measured soil properties, forest structure, and management type, influence forest understorey FD at the macroecological scale. Our study covers Italian forests, using thirteen predictors categorized into climate, soil, forest structure, and management. We analyzed five traits (i.e., specific leaf area, plant size, seed mass, belowground bud bank size, and clonal lateral spread) capturing independent functional dimensions to calculate the standardized effect size of functional diversity (SES-FD) for all traits (multi-trait) and for single traits. Multiple regression models were applied to assess the effect of predictors on SES-FD. We revealed that climate, soil, and forest structure significantly drive SES-FD of specific leaf area, plant size, seed mass, and bud bank. Forest management had a limited effect. However, differences emerged between herbaceous and woody growth forms of the understorey layer, with herbaceous species mainly responding to climate and soil features, while woody species were mainly affected by forest structure. Future warmer and more seasonal climate could reduce the diversity of resource economics, plant size, and persistence strategies of the forest understorey. Soil eutrophication and acidification may impact the diversity of regeneration strategies; canopy closure affects the diversity of above- and belowground traits, with a larger effect on woody species. Multifunctional approaches are vital to disentangle the effect of global changes on functional diversity since independent functional specialization axes are modulated by different drivers. © 2024 The Authors
A co-registration approach between terrestrial and UAV laser scanning point clouds based on ground and trees features
Mostra abstract
Accurate co-registration of terrestrial and aerial point clouds can provide a high-resolution description of tree components across large forest areas. However, a semi-automatic approach for co-registering point clouds is still needed, given the challenges in geospatial data processing, particularly in complex topographical conditions. The main objective of this study is to present the application of a novel procedure for the co-registration of point clouds obtained from terrestrial and UAV surveys in Mediterranean forests. The proposed methodology proves to be promising and will constitute the basis for experimentation on a larger scale. © 2024 Istituto Sperimentale per la Selvicoltura. All rights reserved.
Performance assessment of two plotless sampling methods for density estimation applied to some Alpine forests of northeastern Italy
accuracy
conditional inference trees
distance-based density estimator
forest monitoring
ordered distance method
point-centred quarter method
precision
Mostra abstract
In this study, we tested two plotless sampling methods, the ordered distance method and point-centred quarter method, to estimate the tree density and basal area in some managed Alpine forests in northeastern Italy. We selected nine independent forest stands, classified according to the spatial distribution patterns of trees (cluster, random, regular). A plotless sampling survey was simulated within the selected stands and the tree density and basal area were estimated by applying both the ordered distance method and point-centred quarter method. We compared the estimates, in terms of accuracy and preci-sion, between the two methods and against estimates obtained from a simulated survey based on a plot-based sampling method. The point-centred quarter method outperformed the ordered distance method in terms of both accuracy and precision, showing higher robustness towards the bias related to non-random spatial patterns. However, both the plotless methods we tested can provide unbiased accuracy of estimates which, in addition, do not differ from estimates of plot-based sampling. The satisfactory results are encouraging for further tests over other Italian Alpine as well as Apennine forests. If con-firmed, the plotless sampling method, especially the point-centred quarter method, could represent an effective alternative whenever plot-based sampling is deemed redundant, or expensive. © SISEF.
Mapping Understory Vegetation Density in Mediterranean Forests: Insights from Airborne and Terrestrial Laser Scanning Integration
forest biodiversity
lidar
terrestrial laser scanner
forest structure
spatial prediction
voxelization
Mostra abstract
The understory is an essential ecological and structural component of forest ecosystems. The lack of efficient, accurate, and objective methods for evaluating and quantifying the spatial spread of understory characteristics over large areas is a challenge for forest planning and management, with specific regard to biodiversity and habitat governance. In this study, we used terrestrial and airborne laser scanning (TLS and ALS) data to characterize understory in a European beech and black pine forest in Italy. First, we linked understory structural features derived from traditional field measurements with TLS metrics, then, we related such metrics to the ones derived from ALS. Results indicate that (i) the upper understory density (5–10 m above ground) is significantly associated with two ALS metrics, specifically the mean height of points belonging to the lower third of the ALS point cloud within the voxel (HM<inf>1/3</inf>) and the corresponding standard deviation (SD<inf>1/3</inf>), while (ii) for the lower understory layer (2–5 m above ground), the most related metric is HM<inf>1/3</inf> alone. As an example application, we have produced a map of forest understory for each layer, extending over the entire study region covered by ALS data, based on the developed spatial prediction models. With this study, we also demonstrated the power of hand-held mobile-TLS as a fast and high-resolution tool for measuring forest structural attributes and obtaining relevant ecological data. © 2023 by the authors.
Wall-to-Wall Mapping of Forest Biomass and Wood Volume Increment in Italy
Giannetti
,
Francesca
,
Chirici
,
Gherardo
,
Vangi
,
Elia
,
Corona
,
P.
,
Maselli
,
Fabio
,
Chiesi
,
Marta
,
D'Amico
,
Giovanni
,
Puletti
,
Nicola
Mostra abstract
Several political initiatives aim to achieve net-zero emissions by the middle of the twenty-first century. In this context, forests are crucial as a carbon sink to store unavoidable emissions. Assessing the carbon sequestration potential of forest ecosystems is pivotal to the availability of accurate forest variable estimates for supporting international reporting and appropriate forest management strategies. Spatially explicit estimates are even more important for Mediterranean countries such as Italy, where the capacity of forests to act as sinks is decreasing due to climate change. This study aimed to develop a spatial approach to obtain high-resolution maps of Italian forest above-ground biomass (ITA-BIO) and current annual volume increment (ITA-CAI), based on remotely sensed and meteorological data. The ITA-BIO estimates were compared with those obtained with two available biomass maps developed in the framework of two international projects (i.e., the Joint Research Center and the European Space Agency biomass maps, namely, JRC-BIO and ESA-BIO). The estimates from ITA-BIO, JRC-BIO, ESA-BIO, and ITA-CAI were compared with the 2nd Italian NFI (INFC) official estimates at regional level (NUT2). The estimates from ITA-BIO are in good agreement with the INFC estimates (R<sup>2</sup> = 0.95, mean difference = 3.8 t ha<sup>−1</sup>), while for JRC-BIO and ESA-BIO, the estimates show R<sup>2</sup> of 0.90 and 0.70, respectively, and mean differences of 13.5 and of 21.8 t ha<sup>−1</sup> with respect to the INFC estimates. ITA-CAI estimates are also in good agreement with the INFC estimates (R<sup>2</sup> = 0.93), even if they tend to be slightly biased. The produced maps are hosted on a web-based forest resources management Decision Support System developed under the project AGRIDIGIT (ForestView) and represent a key element in supporting the new Green Deal in Italy, the European Forest Strategy 2030 and the Italian Forest Strategy. © 2022 by the authors.
coveR: an R package for processing digital cover photography images to retrieve forest canopy attributes
Mostra abstract
Key message: coveR is an R package for estimating canopy attributes from digital cover photography (DCP) images. The simplicity of the method and the open-accessibility of coveR can effectively extend the accessibility and applicability of DCP to a wider audience. Abstract: Digital cover photography (DCP) is an increasingly popular tool for estimating canopy cover and leaf area index (LAI). However, existing solutions to process canopy images are predominantly tailored for hemispherical photography, whereas open-access tools for DCP are lacking. We developed an R package (coveR) to support the whole processing of DCP images in an automated, fast, and reproducible way. The package functions, which are designed for step-by-step single-image analysis, can be performed sequentially in a pipeline while ensuring quality-checking of each processing step. A wrapper function ‘coveR()’ is also created to perform all the image processing workflow in a single function. A case study is presented to demonstrate the reliability of canopy attributes derived from coveR in pure beech (Fagus sylvatica L.) stands with variable canopy density and structure. Estimates of gap fraction and effective LAI from DCP were validated against reference measurements obtained from terrestrial laser scanning. By providing a simple, transparent, and flexible image processing procedure, coveR supported the use of DCP for routine measurements and monitoring of forest canopy attributes. This, combined with the possibility to implement DCP in many devices, including smartphones, micro-cameras, and remote trail cameras, can greatly expand the accessibility of the method also by non-experts. © 2022, The Author(s), under exclusive licence to Springer-Verlag GmbH Germany, part of Springer Nature.
From model selection to maps: A completely design-based data-driven inference for mapping forest resources
Di Biase
,
Rosa Maria
,
Fattorini
,
Lorenzo
,
Franceschi
,
Sara
,
Grotti
,
Mirko
,
Puletti
,
Nicola
,
Corona
,
P.
density estimation
harmonization
model selection
predictions
pseudopopulation bootstrap
regression estimator
residuals
smoothing parameter
spatial interpolation
Mostra abstract
A completely data-driven, design-based sampling strategy is proposed for mapping a forest attribute within the spatial units tessellating a survey region. Based on sample data, a model is selected, and model parameters are estimated using least-squares criteria for predicting the attribute of interest within units as a linear function of a set of auxiliary variables. The spatial interpolation of residuals arising from model predictions is performed by inverse distance weighting. The leave-one-out cross validation procedure is adopted for selecting the smoothing parameter used for interpolation. The densities of the attributes of interest within units are estimated by summing predictions and interpolated residuals. Finally, density estimates are rescaled to match the total estimate over the survey region obtained by the traditional regression estimator with the total estimate obtained from the map as the sum of the density estimates within units. A bootstrap procedure accounts for the uncertainty. The consistency of the strategy is proven by incorporating previous results. A simulation study is performed and an application for mapping wood volume densities in the forest estate of Rincine (Central Italy) is described. © 2022 John Wiley & Sons Ltd.
Potential of ALOS2 Polarimetric Imagery to Support Management of Poplar Plantations in Northern Italy
Vaglio Laurin
,
Gaia
,
Mattioli
,
Walter
,
Innocenti
,
Simone
,
Lombardo
,
Emanuela
,
Valentini
,
Riccardo
,
Puletti
,
Nicola
Mostra abstract
Poplar is one of the most widespread fast-growing forest species. In Northern Italy, plantations are characterized by large interannual fluctuations, requiring frequent monitoring to inform on wood supply and to manage the stands. The use of radar satellite data is proving useful for forest monitoring, being weather independent and sensitive to the changes in forest canopy structure, but it has been scarcely tested in the case of poplar. Here, L-band ALOS2 (Advanced Land Observing Satellite-2) dual-pol data were tested to detect clear-cut plantations in consecutive years. ALOS2 quad-pol data were used to discriminate among different age classes, a much complex task than detecting poplar plantations extent. Results from different machine learning algorithms indicate that with dual-pol data, poplar forest can be discriminated from clear-cut areas with 80% overall accuracy, similar to what is usually obtained with optical data. With quad-pol data, four age classes were classified with moderate overall accuracy (73%) based on polarimetric decompositions, three 3 age classes with higher accuracy (87%) based on HV band. Sources of error are represented by poplar areas of intermediate age when stems, branches and leaves were not developed enough to detect by scattering mechanisms. This study demonstrates the feasibility of monitoring poplar plantations with satellite radar, which represents a growing source of information thanks to already-planned future satellite missions. © 2022 by the authors.
A georeferenced dataset of nocturnal macrolepidoptera: A tool for forest management and biodiversity conservation
Mostra abstract
In this paper we provide a georeferenced dataset of raw data concerning occurrence and abundance of nocturnal macrolepidoptera, an insect group largely recognized as a good ecological indicator of forest ecosystems. Data have been collected by using light traps located in 15 beech and 20 Calabrian black pine forest lots, 20 of which included in Natura 2000 sites. The sampling was carried out monthly lasting from May to late October 2019 and 2020 in order to cover the entire period during which favourable conditions for adult monitoring occurred, and to encompass phenological changes occurring across seasons in moth diversity. The dataset is composed by a total of 42,834 individuals belonging to 363 species. Due to the relatively small attractive radius of used light traps (about 25 m), georeferenced lepidopteran data can be easily correlated to any kind of spatial environmental variables and forest attributes and to their temporal variations being useful to quantify also the effects of long-term ecological drivers. © 2022
Enhancing wall-to-wall forest structure mapping through detailed co-registration of airborne and terrestrial laser scanning data in Mediterranean forests
Mostra abstract
This paper presents a new co-registration procedure of complementary point clouds captured by both Terrestrial (TLS) and Airborne Laser Scanning (ALS) technologies. Starting from the geographic position of the TLS point cloud, a geometric features recognition algorithm, which evaluates digital terrain models obtained from both ALS and TLS, was developed and implemented in a new GIS software (ForeSight®). As a case study, we tested this new approach using point clouds acquired from both hand-held mobile TLS and ALS sensors over 24 test sites located in a protected area in southern Italy, with the ultimate goal of characterizing the different forest stand structures. From each aligned point cloud, a plot-level spatially explicit index (Enhanced Structural Spatial Index, ESCI) was derived to assess the three-dimensional structure of the considered forest stands. Then, we compared structural features derived from the ESCI index with different computed ALS metrics. Finally, the most correlated ALS metrics were used as predictors to produce an ESCI-map of the entire region of interest. © 2021 Elsevier B.V.
Estimated biomass loss caused by the vaia windthrow in northern italy: Evaluation of active and passive remote sensing options
Vaglio Laurin
,
Gaia
,
Puletti
,
Nicola
,
Tattoni
,
Clara
,
Ferrara
,
Carlotta
,
Pirotti
,
Francesco
Mostra abstract
Windstorms are a major disturbance factor for European forests. The 2018 Vaia storm, felled large volumes of timber in Italy causing serious ecological and financial losses. Remote sensing is fundamental for primary assessment of damages and post‐emergency phase. An explicit estimation of the timber loss caused by Vaia using satellite remote sensing was not yet undertaken. In this investigation, three different estimates of timber loss were compared in two study sites in the Alpine area: pre‐existing local growing stock volume maps based on lidar data, a recent national‐level forest volume map, and an novel estimation of AGB values based on active and passive remote sensing. The compared datasets resemble the type of information that a forest manager might potentially find or produce. The results show a significant disagreement in the different biomass estimates, related to the methods used to produce them, the study areas characteristics, and the size of the damaged areas. These sources of uncertainty highlight the difficulty of estimating timber loss, unless a unified national or regional European strategy to improve preparedness to forest hazards is defined. Considering the frequent impacts on forest resources that occurred in the last years in the European Union, remote sensing‐based surveys targeting forests is urgent, particularly for the many European countries that still lack reliable forest stocks data. © 2021 by the authors. Licensee MDPI, Basel, Switzerland.
Characterizing subcanopy structure of Mediterranean forests by terrestrial laser scanning data
forest biodiversity
lidar
terrestrial laser scanner
forest structure
spatial prediction
voxelization
Mostra abstract
Vegetation structure is one of the key factors in forest ecosystems. Especially understory structure has major implications for wildlife habitat selection, reproduction, and survival. Structural indices traditionally used to characterize understory vegetation are based on field vegetation surveys describing general features such as leaf area index (LAI), canopy cover or vegetation height, hiding much of the three-dimensional vegetation structure complexity. The application of terrestrial laser scanning (TLS) in forest ecological and management applications is becoming more effective. In this study, we use TLS data to quantify spatial attributes of forest subcanopy in four different forest strata ranging from 0.5 m to 10 m from the ground. We collected data in 12 plots of mature European beech (Fagus sylvatica L.) forests and 12 plots of mature black pine (Pinus nigra subsp. laricio Maire) forests, located in the Sila National Park, Italy. We propose a TLS-based approach to estimate a fine-scale vegetation density using the Plant Density Index (PDI) and to test the PDI at different height classes. We found a significant relationship between the PDI and the number of trees belonging to the dominant layer, using the Spearman correlation coefficient (r = 0.83, p<inf>val</inf> = 0.001). Basing on PDI values, a cluster analysis of the four subcanopy strata was carried out for deriving clusters of structurally homogeneous forest plots. Results identified three clusters in terms of the vegetation features in the horizontal height classes: the first cluster primarily includes Beech forests characterized by plots with the highest tree densities; the second one includes both Beech and Pine forests characterized by dense ground vegetation and shrubs and an intermediate tree density; the third group is represented by Pine forests with massive presence of vegetation lower strata and moderate tree density. Then, PCA allowed identifying the relationship between the considered subcanopy layers and forest plots. © 2021 Elsevier B.V.
Traditional and TLS-based forest inventories of beech and pine forests located in Sila National Park: A dataset
Mostra abstract
Vegetation structure is a key determinant of species distribution and diversity. Compared to traditional methods, the use of Terrestrial Laser Scanning (TLS) has allowed massive amounts of point cloud data collected for quantifying three-dimensional habitat properties at increasing spatial and temporal scales. We used TLS to characterize the forest plots across a broad range of forest structural diversity, located in the Sila National Park, South Italy. The dataset reports data collected in 24 15-m-radius circular plots, 12 of which were dominated by beech (Fagus sylvatica L.) and 12, by black pine (Pinus nigra subsp. laricio). In detail, this work provides dataset of i) plot-level attributes calculated from raw data, such as the number of trees, ii) tree-level data, comprising a total of 1709 trees, with information related to field-based forest inventory such as the diameter at breast height (DBH), and iii) plot-level information related to the time for conducting both traditional field- and TLS-based forest inventories. Compared to traditional methods, the use of TLS allows a very high-resolution quantification of the 3D forest structural properties, also reducing the time for conducting forest inventories. © 2020
Influence of voxel size and point cloud density on crown cover estimation in poplar plantations using terrestrial laser scanning
Mostra abstract
Accurate estimates of crown cover (CC) are central for a wide range of forestry studies. As direct measurements do not exist to retrieve this variable in the field, CC is conventionally determined from optical measurements as the complement of gap fraction close to the zenith. As an alternative to passive optical measurements, active sensors like terrestrial Light Detection And Ranging (LiDAR) allows for characterizing the 3D canopy structure with unprecedented detail. We evaluated the reliability of terrestrial LiDAR (TLS) to estimate CC using a voxel-based approach. Specifically, we tested how different voxel sizes (ranging from 5-20 cm) and voxel densities (1-9 points/dm<sup>3</sup>) influenced the retrieval of CC. Results were compared against benchmark values obtained from digital cover photography (DCP). The trial was performed in hybrid poplar plantations in Northern Italy. Results indicate that TLS can be used for obtaining accurate estimates of CC, but the choice of voxel size and point density is critical for achieving such accuracy. In hybrid poplars, the best performance was obtained using voxel size of 10 cm and point density of 8 points/dm<sup>3</sup>. The combined ability of measuring and mapping CC also holds great potential to use TLS for calibrating and upscaling results using coarser-scale remotely sensed products. © 2021 Centro di Ricerca per la Selvicoltura, Consiglio per la Ricerca in Agricoltura e l'Analisi dell'Economia Agraria. All rights reserved.
A deep learning approach for automatic mapping of poplar plantations using Sentinel-2 imagery
D'Amico
,
Giovanni
,
Francini
,
Saverio
,
Giannetti
,
Francesca
,
Vangi
,
Elia
,
Travaglini
,
Davide
,
Chianucci
,
Francesco
,
Mattioli
,
Walter
,
Grotti
,
Mirko
,
Puletti
,
Nicola
,
Corona
,
P.
,
Chirici
,
Gherardo
deep learning
big data
forest tree crops
fully connected neural networks
multitemporal classification
tree species mapping
Mostra abstract
Poplars are one of the most widespread fast-growing tree species used for forest plantations. Owing to their distinct features (fast growth and short rotation) and the dependency on the timber price market, poplar plantations are characterized by large inter-annual fluctuations in their extent and distribution. Therefore, monitoring poplar plantations requires a frequent update of information–not feasible by National Forest Inventories due to their periodicity–achievable by remote sensing systems applications. In particular, the new Sentinel-2 mission, with a revisiting period of 5 days, represents a potentially efficient tool for meeting this need. In this paper, we present a deep learning approach for mapping poplar plantations using Sentinel-2 time series. A reference dataset of poplar plantations was available for a large study area of more than 46,000 km<sup>2</sup> in Northern Italy and served as training and testing data. Two classification methods were compared: (1) a fully connected neural network (also called multilayer perceptron), and (2) a traditional logistic regression. The performance of the two approaches was estimated through bootstrapping procedure with a confidence interval of 99%. Results indicated for deep learning an omission error rate of 2.77%±2.76%, showing improvements compared to logistic regression, omission error rate = 8.91%±4.79%. © 2021 Informa UK Limited, trading as Taylor & Francis Group.
Estimation of forest leaf area index using satellite multispectral and synthetic aperture radar data in Iran
Vafaei
,
Sasan
,
Fathizadeh
,
Omid
,
Puletti
,
Nicola
,
Fadaei
,
Hadi
,
Rasooli
,
Sabri Baqer
,
Vaglio Laurin
,
Gaia
Mostra abstract
Different satellite datasets, including multispectral Sentinel 2 and synthetic aperture radar Sentinel 1 and ALOS2, were tested to estimate the Leaf Area Index (LAI) in the Zagros forests, Ilam province, in Iran. Field data were collected in 61 sample plots by hemispherical photographs, to train and validate the LAI estimation models. Different satellite data combinations were used as input in regression models built with the following algorithms: Multiple Linear Regression, Random Forests, and Partial Least Square Regression. The results indicate that Leaf Area Index can be best estimated using integrated ALOS2 and Sentinel 2 data; these inputs generated the model with higher accuracy (R<sup>2</sup> = 0.84). The combination of a single band and a vegetation index from Sentinel 2 also led to successful results (R<sup>2</sup> = 0.81). Lower accuracy was obtained when using only ALOS 2 (R<sup>2</sup> = 0.72), but this dataset is helpful where cloud coverage affects optical data. Sentinel 1 data was not useful for LAI predic-tion. The optimal model was based on the traditional Multiple Linear Regression algorithm, using a preliminary input selection step to exclude multi-collinearity effects. To avoid this step, the use of Partial Least Square Regression may be an alternative, as this algorithm was able to produce estimates similar to those obtained with the best model. © SISEF.
Influence of image pixel resolution on canopy cover estimation in poplar plantations from field, aerial and satellite optical imagery
Chianucci
,
Francesco
,
Puletti
,
Nicola
,
Grotti
,
Mirko
,
Bisaglia
,
Carlo
,
Giannetti
,
Francesca
,
Romano
,
Elio
,
Brambilla
,
Massimo
,
Mattioli
,
Walter
,
Cabassi
,
Giovanni
,
Bajocco
,
Sofia
,
Li
,
Linyuan
,
Chirici
,
Gherardo
,
Corona
,
P.
,
Tattoni
,
Clara
Mostra abstract
Accurate estimates of canopy cover (CC) are central for a wide range of forestry studies. As direct measurements are impractical, indirect optical methods have often been used to estimate CC from the complement of gap fraction measurements obtained with restricted-view sensors. In this short note we evaluated the influence of the image pixel resolution (ground sampling distance; GSD) on CC estimation in poplar plantations obtained from field (cover photography; GSD < 1 cm), unmanned aerial (UAV; GSD <10 cm) and satellite (Sentinel-2; GSD = 10 m) imagery. The trial was conducted in poplar tree plantations in Northern Italy, with varying age and canopy cover. Results indicated that the coarser resolution available from satellite data is suitable to obtain estimates of canopy cover, as compared with field measurements obtained from cover photography; therefore, S2 is recommended for larger scale monitoring and routine assessment of canopy cover in poplar plantations. The higher resolution of UAV compared with Sentinel-2 allows finer assessment of canopy structure, which could also be used for calibrating metrics obtained from coarser-scale remote sensing products, avoiding the need of ground measurements. © 2021 Centro di Ricerca per la Selvicoltura, Consiglio per la Ricerca in Agricoltura e l'Analisi dell'Economia Agraria. All rights reserved.
Nondestructive tree stem and crown volume allometry in hybrid poplar plantations derived from terrestrial laser scanning
Chianucci
,
Francesco
,
Puletti
,
Nicola
,
Grotti
,
Mirko
,
Ferrara
,
Carlotta
,
Giorcelli
,
Achille
,
Coaloa
,
Domenico
,
Tattoni
,
Clara
Mostra abstract
Accurate and frequently updated tree volume estimates are required for poplar plantations, which are characterized by fast growth rate and short rotation. In this study, we tested the potential of terrestrial laser scanning (TLS) as a reliable method for developing nondestructive tree volume allometries in poplar plantations. The trial was conducted in Italy, where 4- to 10-year-old hybrid plantations were sampled to develop tree crown volume allometry in leaf-on conditions, tree stem volume, and height-diameter allometries in leaf-off conditions. We tested one-entry models based on diameter and two-entry models based on both diameter and height. Model performance was assessed by residual analysis. Results indicate that TLS can provide accurate models of tree stem and crown volume, with percentage of root-mean-square error of about 20 percent and 15 percent, respectively. The inclusion of height does not bring relevant improvement in the models, so that only diameter can be used to predict tree stem and crown volume. The TLS-measured stem volume estimates agreed with an available formula derived from harvesting. We concluded that TLS is a reliable method for developing nondestructive volume allometries in poplar plantations and holds great potential to enhance conventional tree inventory and monitoring. © The Author(s) 2020. Published by Oxford University Press on behalf of the Society of American Foresters. All rights reserved.
Plant functional traits are correlated with species persistence in the herb layer of old-growth beech forests
Campetella
,
Giandiego
,
Chelli
,
Stefano
,
Simonetti
,
Enrico
,
Damiani
,
Claudia
,
Bartha
,
Sándor
,
Wellstein
,
Camilla
,
Giorgini
,
Daniele
,
Puletti
,
Nicola
,
Mucina
,
Ladislav
,
Cervellini
,
Marco
,
Canullo
,
R.
beech
forest
genetics
plant leaf
plant seed
quantitative trait
fagus
forests
plant leaves
heritable
seeds
Mostra abstract
This paper explores which traits are correlated with fine-scale (0.25 m<sup>2</sup>) species persistence patterns in the herb layer of old-growth forests. Four old-growth beech forests representing different climatic contexts (presence or absence of summer drought period) were selected along a north–south gradient in Italy. Eight surveys were conducted in each of the sites during the period spanning 1999–2011. We found that fine-scale species persistence was correlated with different sets of plant functional traits, depending on local ecological context. Seed mass was found to be as important for the fine-scale species persistence in the northern sites, while clonal and bud-bank traits were markedly correlated with the southern sites characterised by summer drought. Leaf traits appeared to correlate with species persistence in the drier and wetter sites. However, we found that different attributes, i.e. helomorphic vs scleromorphic leaves, were correlated to species persistence in the northernmost and southernmost sites, respectively. These differences appear to be dependent on local trait adaptation rather than plant phylogenetic history. Our findings suggest that the persistent species in the old-growth forests might adopt an acquisitive resource-use strategy (i.e. helomorphic leaves with high SLA) with higher seed mass in sites without summer drought, while under water-stressed conditions persistent species have a conservative resource-use strategy (i.e. scleromorphic leaves with low SLA) with an increased importance of clonal and resprouting ability. © 2020, The Author(s).
Probabilistic sampling and estimation for large-scale assessment of poplar plantations in Northern Italy
Corona
,
P.
,
Chianucci
,
Francesco
,
Marcelli
,
Agnese
,
Gianelle
,
Damiano
,
Fattorini
,
Lorenzo
,
Grotti
,
Mirko
,
Puletti
,
Nicola
,
Mattioli
,
Walter
Mostra abstract
In the recent decades, growing demand for wood products, combined with efforts to conserve natural forests, has supported a steady increase in the global extent of planted forests. In this paper, a two-phase sampling strategy for large-scale assessment of hybrid poplar plantations in Northern Italy was implemented. The first phase was performed by means of tessellation stratified sampling on high-resolution remotely sensed imagery, covering the survey area by a grid of regular polygons of equal size and randomly and independently selecting one point per quadrat. All the plantations spotted by at least one sample point were selected. In the second phase, we randomly chosen a subset of plantations by stratified sampling that were visited on the ground to collect qualitative and quantitative attributes. The resulting estimates were reliable, and the survey demonstrated relatively easy to be implemented and replicated. These considerations support the use of the proposed sampling strategy to frequently update information on fast-growing forest plantations within agricultural farms, like hybrid poplar crops. Moreover, the results of the case study here presented highlight the relevance of hybrid poplar plantations in Italy, in the context of sustainable development strategies under a green economy perspective. © 2020, Springer-Verlag GmbH Germany, part of Springer Nature.
Species dominance and above ground biomass in the Białowieża Forest, Poland, described by airborne hyperspectral and lidar data
Vaglio Laurin
,
Gaia
,
Puletti
,
Nicola
,
Grotti
,
Mirko
,
Stereńczak
,
Krzysztof Jan
,
Modzelewska
,
Aneta
,
Lisiewicz
,
Maciej
,
Sadkowski
,
Rafał
,
Kuberski
,
Łukasz
,
Chirici
,
Gherardo
,
Papale
,
Dario
climate change
lidar
aboveground biomass
algorithm
data set
deciduous tree
species diversity
species richness
vegetation dynamics
bialowieza forest
scolytinae
Mostra abstract
The objective of this research is to test and evaluate hyperspectral and lidar data to derive information on tree species dominance and above ground biomass in the Białowieża Forest in Poland. This forest is threatened by climate change, fire, bark beetles attacks, and logging, with changes in species composition and dominance. In this conservation valuable area, the monitoring of forest resources is thus critical. Results indicate that vegetation indices from hyperspectral data can support species dominance detection: using a Classification and Regression Trees algorithm the three main plot types (dominated by Deciduous, Spruce, and Pines species) were classified with an Overall Accuracy > 0.9. The accuracy decreased when a ‘Mixed’ group was added to account for very heterogeneous plots, and plots dominated by Spruce were not correctly detected. Hyperspectral vegetation indices were also used to estimate the level of species dominance in the forest plots, using a Multivariate Multiple Linear Regression model; the obtained accuracy varied according to groups, being higher for Deciduous (R<sup>2</sup> = 0.87), compared to Pines (R<sup>2</sup> = 0.61), and to Spruce-dominated plots (R<sup>2</sup> = 0.37). Lidar data were employed to estimate above ground biomass, using an exponential regression model; overall the R<sup>2</sup> resulted equal to 0.66 but ranged from 0.57 to 0.78 when considering subgroups according to species dominance; the addition of hyperspectral vegetation indices improved the result only for Pines. The illustrated methods provide a reliable description of important forest characteristics and simplify resource monitoring, supporting local authorities to address the challenges imposed by climate change and other forest threats. © 2020 The Authors
Lidar-based estimates of aboveground biomass through ground, aerial, and satellite observation: A case study in a Mediterranean forest
aboveground biomass
global ecosystem dynamics investigation mission
light detection and ranging
mobile terrestrial laser scanner
Mostra abstract
Light detection and ranging (Lidar) is considered the most advanced technology to assess forest aboveground biomass (AGB). Currently, this technology is shared by different sensors ranging from ground [terrestrial laser scanning (TLS)], airborne [aerial laser scanning (ALS)] up to spaceborne ones, which entail different spatial scales. However, few studies tested the simultaneous and combined use of Lidar to estimate AGB, linking ground measurements up to satellite observations. To fill this gap, we performed a study in two Mediterranean forest types [i.e., mountainous beech (Fagus sylvatica) and black pine (Pinus nigra subsp. laricio)] with contrasting structures (i.e., broadleaf versus needleleaf forests), where field inventory, TLS, ALS, and the recent spaceborne Global Ecosystem Dynamics Investigation (GEDI) data were simultaneously acquired. A three-step procedure was followed, which involved (i) the validation of AGB estimates obtained from TLS against reference values obtained from conventional field inventory; (ii) the calibration and validation of AGB estimates derived from ALS against TLS measurements, and (iii) the calibration and validation of AGB estimates derived from GEDI against mapped AGB values obtained from ALS. Our main results indicated that TLS provides consistent measurements of AGB as compared with field measurements (R2 ranged between 0.6 and 0.9 and root-mean-square error ranged between 29% and 49%), indicating its potential as ground reference for airborne Lidar observations. The combined availability of ground, airborne, and spaceborne observations is suitable to link ground measurements up to satellite observations. Differences in Lidar performance between needleleaf and broadleaf forests are also considered and discussed. © 2020 Society of Photo-Optical Instrumentation Engineers (SPIE).
Assessment of UAV photogrammetric DTM-independent variables for modelling and mapping forest structural indices in mixed temperate forests
Giannetti
,
Francesca
,
Puletti
,
Nicola
,
Puliti
,
Stefano
,
Travaglini
,
Davide
,
Chirici
,
Gherardo
biodiversity
precision forestry
forest structure
forest inventory
airborne laser scanning
drone
dtm-independent
structure from motion
Mostra abstract
In the EU 2020 biodiversity strategy, maintaining and enhancing forest biodiversity is essential. Forest managers and technicians should include biodiversity monitoring as support for sustainible forest management and conservation issues, through the adoption of forest biodiversity indices. The present study investigates the potential of a new type of Structure from Motion (SfM) photogrammetry derived variables for modelling forest structure indicies, which do not require the availability of a digital terrain model (DTM) such as those obtainable from Airborne Laser Scanning (ALS) surveys. The DTM-independent variables were calculated using raw 3D UAV photogrammetric data for modeling eight forest structure indices which are commonly used for forest biodiversity monitoring, namely: basal area (G); quadratic mean diameter (DBH<inf>mean</inf>); the standard deviation of Diameter at Breast Height (DBH<inf>σ</inf>); DBH Gini coefficient (Gini); the standard deviation of tree heights (H<inf>σ</inf>); dominant tree height (H<inf>dom</inf>); Lorey's height (H<inf>l</inf>); and growing stock volume (V). The study included two mixed temperate forests areas with a different type of management, with one area, left unmanaged for the past 50 years while the other being actively managed. A total of 30 field sample plots were measured in the unmanaged forest, and 50 field plots were measured in the actively managed forest. The accuracy of UAV DTM-independent predictions was compared with a benchmark approach based on traditional explanatory variables calculated from ALS data. Finally, DTM-independent variables were used to produce wall-to-wall maps of the forest structure indices in the two test areas and to estimate the mean value and its uncertainty according to a model-assisted regression estimators. DTM-independent variables led to similar predictive accuracy in terms of root mean square error compared to ALS in both study areas for the eight structure indices (DTM-independent average RMSE<inf>%</inf> = 20.5 and ALS average RMSE<inf>%</inf> = 19.8). Moreover, we found that the model-assisted estimation, with both DTM-independet and ALS, obtained lower standar errors (SE) compared to the one obtained by model-based estimation using only field plots. Relative efficiency coefficient (RE) revealed that ALS-based estimates were, on average, more efficient (average RE ALS = 3.7) than DTM-independent, (average RE DTM-independent = 3.3). However, the RE for the DTM-independent models was consistently larger than the one from the ALS models for the DBH-related variables (i.e. G, DBH<inf>mean</inf>, and DBH<inf>σ</inf>) and for V. This highlights the potential of DTM-independent variables, which not only can be used virtually on any forests (i.e., no need of a DTM), but also can produce as precise estimates as those from ALS data for key forest structural variables and substantially improve the efficiency of forest inventories. © 2020 Elsevier Ltd
Global airborne laser scanning data providers database (GlobALS)-A new tool for monitoring ecosystems and biodiversity
Stereńczak
,
Krzysztof Jan
,
Vaglio Laurin
,
Gaia
,
Chirici
,
Gherardo
,
Coomes
,
David Anthony
,
Dalponte
,
Michele
,
Latifi
,
Hooman
,
Puletti
,
Nicola
Mostra abstract
Protection and recovery of natural resource and biodiversity requires accurate monitoring at multiple scales. Airborne Laser Scanning (ALS) provides high-resolution imagery that is valuable for monitoring structural changes to vegetation, providing a reliable reference for ecological analyses and comparison purposes, especially if used in conjunction with other remote-sensing and field products. However, the potential of ALS data has not been fully exploited, due to limits in data availability and validation. To bridge this gap, the global network for airborne laser scanner data (GlobALS) has been established as a worldwide network of ALS data providers that aims at linking those interested in research and applications related to natural resources and biodiversity monitoring. The network does not collect data itself but collects metadata and facilitates networking and collaborative research amongst the end-users and data providers. This letter describes this facility, with the aim of broadening participation in GlobALS. © 2020 by the authors.
An intensity, image-based method to estimate gap fraction, canopy openness and effective leaf area index from phase-shift terrestrial laser scanning
Grotti
,
Mirko
,
Calders
,
Kim
,
Origo
,
Niall
,
Puletti
,
Nicola
,
Alivernini
,
Alessandro
,
Ferrara
,
Carlotta
,
Chianucci
,
Francesco
Mostra abstract
Accurate in situ estimates of leaf area index (LAI) are essential for a wide range of ecological studies and applications. Due to the destructiveness and impracticality of direct measurements, indirect optical methods have mostly been used in the field to derive estimates of LAI from gap fraction measurements. Terrestrial laser scanning (TLS) is strongly supporting use of this active technology, which possesses several advantages compared to passive sensors. However, edge effects and partial beam interceptions are significantly challenges for the accurate retrieval of gap fraction from 3D point cloud data available from TLS, particularly in phase-shift instruments, which in turns require point cloud filtering to correct erroneous point measurements. As the limitations above influences the point cloud, we proposed a new method which is based only on the laser return intensity (LRI) information derived from raw TLS data, which are used to generate 2D intensity images. The intensity image contains all the unfiltered LRI information captured by TLS, which is used to separate gap from non-gap pixels, using a procedure comparable to the standard image analysis processing of digital hemispherical images. This allows a theoretically consistent comparison between active and passive optical measurements of gap fraction across all the zenith angle range. The method was tested in real and simulated forests. Gap fraction, canopy openness and effective leaf area index derived from real and simulated intensity TLS images were compared with those obtained using digital hemispherical photography (DHP). Results indicated that the intensity, image-based method outperformed DHP, as the higher pixel resolution of the intensity images and the larger distance covered by TLS allowed detection of many small canopy elements, particularly at higher zenith angles (longer optical distance), which are not detected in DHP. The main findings support the reliability of the intensity, image-based method to standardize protocols for TLS phase-shift scan data processing and use of the produced canopy estimates as a benchmark for passive optical measurements. © 2019 Elsevier B.V.
Large-scale two-phase estimation of wood production by poplar plantations exploiting sentinel-2 data as auxiliary information
Marcelli
,
Agnese
,
Mattioli
,
Walter
,
Puletti
,
Nicola
,
Chianucci
,
Francesco
,
Gianelle
,
Damiano
,
Grotti
,
Mirko
,
Chirici
,
Gherardo
,
D'Amico
,
Giovanni
,
Francini
,
Saverio
,
Travaglini
,
Davide
,
Fattorini
,
Lorenzo
,
Corona
,
P.
national forest inventories
regression estimator
sentinel-2
design-based inference
first-phase tessellation stratified sampling
second-phase stratified sampling
simulation study
Mostra abstract
Growing demand for wood products, combined with efforts to conserve natural forests, have supported a steady increase in the global extent of planted forests. Here, a two-phase sampling strategy for large-scale assessment of the total area and the total wood volume of fast-growing forest tree crops within agricultural land is presented. The first phase is performed using tessellation stratified sampling on high-resolution remotely sensed imagery and is sufficient for estimating the total area of plantations by means of a Monte Carlo integration estimator. The second phase is performed using stratified sampling of the plantations selected in the first phase and is aimed at estimating total wood volume by means of an approximation of the first-phase Horvitz-Thompson estimator. Vegetation indices from Sentinel-2 are exploited as freely available auxiliary information in a linear regression estimator to improve the design-based precision of the estimator based on the sole sample data. Estimators of the totals and of the design-based variances of total estimators are presented. A simulation study is developed in order to check the design-based performance of the two alternative estimators under several artificial distributions supposed for poplar plantations (random, clustered, spatially trended). An application in Northern Italy is also reported. The regression estimator turns out to be invariably better than that based on the sole sample information. Possible integrations of the proposed sampling scheme with conventional national forest inventories adopting tessellation stratified sampling in the first phase are discussed. © 2020, Finnish Society of Forest Science. All rights reserved.
Widespread Crown Defoliation After a Drought and Heat Wave in the Forests of Tuscany (Central Italy) and Their Recovery—A Case Study From Summer 2017
Mostra abstract
An anomalous event of drought and heat occurred in central Italy during the summer of 2017. Based on the SPI (Standardized Precipitation Index) and data from the European Space Agency, this event started in November 2016 and was characterized by a strong reduction of precipitation and soil moisture, especially in lowland areas with Mediterranean climate. The aim of this case report were to describe the impact of this event on representative forest communities in central Italy, to analyze the different responses of deciduous and evergreen tree and shrub species in contrasting environmental conditions and to assess their subsequent capacity of recovery or, if not, mortality. Trees suffered severe impacts consisting of widespread crown defoliation, leaf desiccation, crown dieback and whole tree mortality. Deciduous tree species (Fagus sylvatica, Quercus pubescens, Quercus cerris) shed their leaves during the summer, but apical buds and twigs were preserved. This allowed these species to produce new shoots in the following year (2018) and to restore the canopy closure of the stands. Mediterranean evergreen broadleaves, such as Quercus ilex and Phillyrea latifolia suffered of total or partial crown desiccation with wilting leaves and branch dieback. These species partially resprouted in 2018 from axillary and latent buds. The case presented here is discussed within the wider context of the impacts of climate change on Mediterranean forests. Future research directions should include an effective forest monitoring system that combines terrestrial and remote sensing surveys, ad hoc field climate change experiments and silvicultural trials from the perspective of proactive management for the adaptation of forests to future climatic conditions. © Copyright © 2019 Pollastrini, Puletti, Selvi, Iacopetti and Bussotti.
Effects of climate, soil, forest structure and land use on the functional composition of the understorey in Italian forests
Chelli
,
Stefano
,
Simonetti
,
Enrico
,
Wellstein
,
Camilla
,
Campetella
,
Giandiego
,
Carnicelli
,
Stefano
,
Andreetta
,
Anna
,
Giorgini
,
Daniele
,
Puletti
,
Nicola
,
Bartha
,
Sándor
,
Canullo
,
R.
plant height
seed mass
specific leaf area
climate–soil interactions
community-weighted mean
functional biogeography
temperature seasonality
trait–environment relationship
Mostra abstract
Question: In functional biogeography studies, generalizable patterns in the relationship between plant traits and the environment have yet to emerge. Local drivers (i.e., soil, land use, vegetation structure) can increase our understanding of the trait–environment relationship. What is the role of climate and local drivers in shaping abundance-weighted trait patterns of forest understories at biogeographic scales?. Location: Italian forests. Methods: We selected 201 sites that are statistically representative for the heterogeneity of Italian forests across three biogeographic regions (alpine, continental, and mediterranean). Understorey vegetation was recorded for each site on an area of 400 m<sup>2</sup>, together with 25 environmental variables related to climate, soil, land use and forest structure. Specific leaf area (SLA), plant height (H) and seed mass (SM) were obtained from databases. Community-weighted mean (CWM) values were calculated. Variance partitioning was used to identify the relative role of groups of environmental variables on the CWM of traits. Generalized Additive Models were used to assess the relationship between traits and single variables. Results: Climate alone and climate–soil interactions explained the largest proportion of the variation of all the traits (13.7% to 22.8%). Temperature-related factors as well as soil N and P availability were the climatic and edaphic explanatory variables most correlated to trait variation. Forest structure and land use accounted for a smaller percentage of the variation in traits. Land-use factors alone were important in explaining only SLA variation. Conclusions: While climate plays a major role in trait–environment relationships in forest understories, our results highlighted the need to integrate at least soil properties as local drivers of trait variation in broad scale functional biogeography studies of these systems. © 2019 International Association for Vegetation Science
Climate is the main driver of clonal and bud bank traits in Italian forest understories
Chelli
,
Stefano
,
Ottaviani
,
Gianluigi
,
Simonetti
,
Enrico
,
Wellstein
,
Camilla
,
Canullo
,
R.
,
Carnicelli
,
Stefano
,
Andreetta
,
Anna
,
Puletti
,
Nicola
,
Bartha
,
Sándor
,
Cervellini
,
Marco
,
Campetella
,
Giandiego
clonality
community weighted mean (cwm)
plant-environment linkages
resprouting
soil properties
trait-based ecology
Mostra abstract
The study of plant trait-environment links is rarely focused on traits that inform on space occupancy and resprouting (both affecting plant persistence), especially in forest understories. Traits that can effectively capture such key functions are associated with clonality and bud banks. We hypothesized that: 1) climate is the main driver of clonal and bud bank traits, 2) traits related to space occupancy (e.g., greater lateral spread) are more important in more mesic, richer soils forests, and 3) traits related to resprouting ability (e.g., larger bud bank) are more important in more intensively and recently managed forests. We addressed these hypotheses by analysing a unique dataset that is statistically representative of Italian forests heterogeneity and includes three biogeographic regions (Alpine, Continental, Mediterranean). We recorded data for sixteen climatic, soil and management variables. We calculated community weighted mean (CWM) values of seven clonal and bud bank traits for the forest understory vegetation. We used i) redundancy analysis to assess trait-environment relations, and ii) variance partitioning analyses to identifying the relative role of different groups of abiotic variables on CWM variation of all traits combined together, as well as clonal and bud bank traits taken separately. Climate alone had a pervasive effect in determining patterns of clonal and bud bank traits in Italian forest understories, mainly related to the effects of temperature extremes and seasonality. Unexpectedly, soil and management factors alone showed marginal effects on clonal and bud bank traits. However, soil features influenced trait patterns when joined with climate. Our results confirmed that, at the biogeographic scale, climate played a lion-share role in determining persistence-related traits of forest-floor plants. At the local-scale, other interplaying factors (e.g., management, soil variables) may come into play in shaping patterns of the studied plant traits. This study stressed the importance of examining functional trait patterns along complex environmental gradients. © 2019 Elsevier GmbH
A plot-level exploratory analysis of European forest based on the results from the BioSoil Forest Biodiversity project
Galluzzi
,
Marta
,
Giannetti
,
Francesca
,
Puletti
,
Nicola
,
Canullo
,
R.
,
Rocchini
,
Duccio
,
Bastrup-Birk
,
Annemarie M.
,
Chirici
,
Gherardo
Mostra abstract
The lack of multi-dimensional data is one of the major gaps which limit the knowledge and the assessment possibilities of European forests. Nowadays, the most extensive and complete data on the European forest statuses are given by National Forest Inventories (NFIs) which provide information about the extent of forest’s resources and their composition and structure. Traditionally, NFIs collect data related to trees, with a limited consideration of other habitat components, such as ground vegetation. This information which goes beyond the mere arboreal component is instead essential for a more complete forest biodiversity assessment. This paper is aimed at introducing the ICP Forests LI-BioDiv database which resulted from BioSoil Forest Biodiversity, a large collaborative European project. This database is organized as a multi-dimensional forest geodatabase that contains forest structure and vegetation records collected in 19 European countries in the period of 2005–2008. The data were acquired from 3311 geocoded plots where several different types of data were gathered: stand-level general information, tree-level data, deadwood, canopy closure and floristic composition. This paper is structured in order to: (1) give a clear overview of the raw data available in the database and to (2) present an elaboration of raw data to calculate simple plot-level forest variables (biomass, deadwood volume, alpha diversity). On the basis of the results we achieved, the LI-BioDiv database appears useful mainly for research purposes aimed at studying cross-relationships between multiple forest variables and not for an operative use for monitoring and assessing European forest. In particular, we hope that this contribution can stimulate scientists to carry out cross-analysis of the database for defining future forest biodiversity indicators that could be introduced into the field protocols of the NFIs in Europe. © 2019, Springer-Verlag GmbH Germany, part of Springer Nature.
A dataset of forest volume deadwood estimates for Europe
Puletti
,
Nicola
,
Canullo
,
R.
,
Mattioli
,
Walter
,
Gawryś
,
Radosław
,
Corona
,
P.
,
Czerepko
,
Janusz
deadwood decay classes
european forest types
icp forests monitoring programme
stand age
stand management
Mostra abstract
Key message: ICP Forests relies on a representative pan-European network based on a 16 × 16 km grid-net covering around 6000 plots. Dead wood volumes for 3243 plots, related to 19 European Countries, are presented in this data paper as a result of harmonised sampling procedure, and under compliance with FAIR Data Principles. Dataset access is at https://zenodo.org/record/1467784. Associated metadata are available athttps://metadata-afs.nancy.inra.fr/geonetwork/srv/fre/catalog.search#/metadata/a27d2a8f-1a2d-4a1c-b932-86ec5f4bd8a6(link to geo-network provided after acceptance). Context: ICP-Forests dataset represents unique opportunity for the assessment of forest resources sustainability and biodiversity in Europe because it monitors the status of forests under a coordinated Pan-European umbrella by standardised methods. Aims: The main goal of this paper is to provide standardized estimates of deadwood volume at European scale for a broader use among forest scientists. Methods: After quality checks, calculations of deadwood volumes distinguished by deadwood types (standing and lying dead trees, snags, coarse woody debris, stumps) have been performed. The obtained plot level data have been joined to available forest stand information (namely: forest type, forest management, and stand age) over 3,243 plots among Europe. Results: The database provides a basis for the evaluation of combined relationships between deadwood volume and forest type, deadwood type, decay status, forest management, and stand age classes at European level. Conclusion: Deadwood volume and quality is recognized as one of the most important source of information for forest biodiversity. Here, first results of a systematic and standardized European survey scheme for assessing deadwood volume are presented. This ICP Forests datasets analysis represents the base for further analysis and relationships. © 2019, INRA and Springer-Verlag France SAS, part of Springer Nature.
Spatio-temporal variability in structure and diversity in a semi-natural mixed oak-hornbeam floodplain forest
Grotti
,
Mirko
,
Chianucci
,
Francesco
,
Puletti
,
Nicola
,
Fardusi
,
Most Jannatul
,
Castaldi
,
Cristiano
,
Corona
,
P.
Mostra abstract
Mixed forests are particularly interesting for forest structure and diversity analyses, as higher complexity and diversity can be expected in these forests compared to pure ones. Integrating different approaches in the analyses of structure and diversity in these forests can provide complementary information on non-spatial, spatial and functional diversity patterns. The study aimed at evaluating the spatio-temporal dynamics in forest structure and diversity in a semi-natural mixed oak-hornbeam floodplain forest. All standing trees were mapped and inventoried in 1995, 2005 and 2016 in three 1-ha mixed forest stands, with different soil moisture regime (xeric, mesic, moist conditions). Traditional, non-spatial structure and diversity measures were coupled with spatially-explicit and functional diversity measures. Results indicated that the three stands showed limited variation in stand structure and similar non-spatial diversity attributes, despite the different species composition. Only the extension to spatial and functional analyses was able to reveal more pronounced differences of diversity patterns, as higher complexity, species mingling, and functional tree complementarity was observed in the moister stand. These findings support use of spatially-explicit measurements in traditional inventory measurement protocols to allow more refined analysis of diversity patterns. On the other hand, functional diversity can be easily implemented in diversity analyses, as it requires species abundance information (which is traditionally collected in forest inventory) and species-specific tree traits which can be inferred from literature. © 2019 Elsevier Ltd
Towards a tool for early detection and estimation of forest cuttings by remotely sensed data
ndvi
forest management
sentinel-2
forest policy
google earth engine
iuti database
lulucf
mediterranean areas
Mostra abstract
Knowing the extent and frequency of forest cuttings over large areas is crucial for forest inventories and monitoring. Remote sensing has amply proved its ability to detect land cover changes, particularly in forested areas. Among various strategies, those focusing on mapping using classification approaches of remotely sensed time series are the most frequently used. The main limit of such approaches stems from the difficulty in perfectly and unambiguously classifying each pixel, especially over wide areas. The same procedure is of course simpler if performed over a single pixel. An automated method for identifying forest cuttings over a predefined network of sampling points (IUTI) using multitemporal Sentinel 2 imagery is described. The method employs normalized difference vegetation index (NDVI) growth trajectories to identify the presence of disturbances caused by forest cuttings using a large set of points (i.e., 1580 "forest" points). We applied the method using a total of 51 S2 images extracted from the Google Earth Engine over two years (2016 and 2017) in an area of about 70 km <sup>2</sup> in Tuscany, central Italy. © 2019 by the authors.
Monitoring the effects of extreme drought events on forest health by Sentinel-2 imagery
Mostra abstract
Global climate change is expected to result in more frequent and intense drought events, especially during the warm season. In such perspective, it is crucial to assess the forest stands vulnerability to extreme climatic events, such as drought, even for Mediterranean forest tree species, commonly considered resistant to dry spell. To test the capability of multitemporal imagery derived by Sentinel-2 (S2) in detecting the impacts of extreme drought events on forest health assessed as crown dieback, some forest stands in Tuscany (central Italy) were analyzed. Vegetation indices (VIs) and ancillary digital terrain model-derived data have been collected in 118 observational samples distributed along an ecological gradient. VIs detected a reduction of trees of photosynthetic activity in August 2017. S2 data have allowed the observation of the different response strategies of the tree species considered in this study to the extreme climatic event that occurred. The case study presented shows that S2 can be applied for monitoring climate-related processes providing a synthetic overview of forest conditions at regional scale. © 2019 Society of Photo-Optical Instrumentation Engineers (SPIE).
Estimating tree diversity in forest ecosystems by two-phase inventories
Corona
,
P.
,
Fattorini
,
Lorenzo
,
Franceschi
,
Sara
,
Marcheselli
,
Marzia
,
Pisani
,
Caterina
,
Chiavetta
,
U.
,
Puletti
,
Nicola
Mostra abstract
Several studies reveal that there is a strong interconnection between climate change and biodiversity. Indeed, estimating plant biodiversity is an important issue under forest ecosystem monitoring, which allows the evaluation of carbon storage and sequestration capacity. To this end, a two-phase strategy, suitably compatible with the most adopted sampling designs in large-scale forest inventories, is proposed. In the first phase, tessellation stratified sampling is performed by partitioning the study area into a grid of quadrats and by randomly selecting a point in each quadrat. The first-phase points are classified as forest or nonforest using remotely sensed imagery. In the second phase, a sample of points is selected from those classified as forest by means of simple random sampling without replacement. The second-phase points constitute the centers of circular plots that are visited in the field to record plant species (usually trees) and their abundance. Estimators of abundance and diversity and estimators of their variances are presented. The proposed strategy is applied in a forest area from Central Italy, as a case study. With respect to the sampling effort, the resulting estimates of relative standard errors are satisfactory, especially those regarding the overall total and diversity index estimators. The proposed statistical approach represents a suitable reference for integrated forest inventory frameworks effectively supporting biodiversity monitoring and assessment. © 2018 John Wiley & Sons, Ltd.
A PLOT SAMPLING STRATEGY FOR ESTIMATING THE AREA OF OLIVE TREE CROPS AND OLIVE TREE ABUNDANCE IN A MEDITERRANEAN ENVIRONMENT
Grotti
,
Mirko
,
Puletti
,
Nicola
,
Chianucci
,
Francesco
,
Mattioli
,
Walter
,
Floris
,
Antonio
,
Clementel
,
Fabrizio
,
Torresan
,
C.
,
Marchi
,
Maurizio
,
Gentile
,
Alessandra
,
Pisante
,
Michele
,
Marcelli
,
Agnese
,
Corona
,
P.
Mostra abstract
Accurate inventory and mapping of olive (Olea europaea L.) tree attributes represents a central issue to support the olive production system. With reference to the cultivation, there is a high heterogeneity and complexity in the cultivation of olive trees, which is reflected in the large variability in olive grove surfaces. This poses some challenge in accurately estimating olive tree attributes via traditional inventory approaches, as commonly adopted in national forest inventory. From a methodological point of view, the complexity and heterogeneity of olive tree groves can be comparable to the problem of accurately estimating tree outside forests (TOF) attributes. In this study, we tested whether a plot sampling approach formerly developed for TOF is suitable for estimating olive tree attributes at large scale. We tested this approach in a case study where the census of the olive crop area and the number of olive groves was conducted from photo-interpretation of high resolution aerial orthoimagery, used as benchmark to test the effectiveness of the plot sampling approach. The main result of this study is that the plot sampling method can be applied for estimating olive tree attributes. Our obtained RSEs were below 20%, with a limited sampling effort of about 6% of the studied population; the obtained RSEs were below 6% when increasing sampling up to about 21% the studied population. Using robust statistical procedures among countries, should allow obtaining harmonized and comparable information, which can increase the knowledge of olive geographical distribution and structure at its relevant Mediterranean scale. © 2019, Italian Society of Remote Sensing. All rights reserved.
EVALUATING ACCURATE POPLAR STEM PROFILES BY TLS
Mostra abstract
The value of wood for different timber assortments can vary by a factor of ten, optimization of stems assortment is hence a key element in the wood products supply chain, particularly for plantations. ‘Taper functions’ are commonly used in other countries to tackle this issue. In Italy, this approach has not yet entered operational use. These functions are developed based on measures of stem diameters taken at different distances from the base. Such measurements are commonly taken felling the tree and using a tape meter and the tree calliper, clearly assuming some approximations. This research assesses the advantages, in terms of assortments evaluation, that can be obtained if the diameters at different heights are extracted adequately processing Terrestrial Laser Scanning (TLS) output. TLS data have been collected, in a poplar plantation, on 36 trees distributed on three stands with different plantation densities in Padana Plane, Italy. The estimated profiles display a very high variability with an average of 1.8 cm of lateral compression. The results from this study demonstrate the potential and feasibility of estimating bole eccentricity by TLS, providing preliminary tools that will hopefully favour the diffusion of taper functions in operational environments. © 2019, Italian Society of Remote Sensing. All rights reserved.
Evaluating the eccentricities of poplar stem profiles with terrestrial laser scanning
Mostra abstract
The value of wood for different timber assortments can vary by a factor of ten. Optimization of stem assortments is, hence, a key element in the wood products supply chain, particularly for plantations. 'Taper functions' are commonly used in other countries to tackle this issue. In Italy, this approach has not yet entered operational use. These functions are developed based on measures of stem diameters taken at different distances from the base. Such measurements are commonly taken felling the tree and using a tape meter and tree caliper, clearly assuming some approximations. This research assesses the advantages, in terms of assortments evaluation, that can be obtained if the diameters at different heights are extracted adequately to process terrestrial laser scanning (TLS) output. TLS data have been collected, in a poplar plantation, on 36 trees distributed on three stands with different plantation densities in Padana Plane, Italy. The estimated profiles display high variability with an average of 1.6 cm of lateral compression. The results from this study demonstrate the potential and feasibility of estimating bole eccentricity by TLS, providing preliminary tools that will hopefully favor the diffusion of taper functions in operational environments. © 2019 by the authors.
Towards the economic valuation of ecosystem production from cork oak forests in sardinia (Italy)
Mostra abstract
A spatially explicit approach for stand-scale economic valuation of current and future potential of cork forests with respect to ecosystem production is developed and presented. The approach, which relies in large part on the mensura-tion of stand top height and number of trees as main drivers, has been tested on the pure cork forests of Sardinia (Italy). The test was conducted to assess the effects of alternative silvicultural options on cork and fodder production, carbon sequestration, and water yield. Under current conditions, the surveyed pure cork oak forest stands in Sardinia are characterized, on average, by an annual economic production of 93 euro ha<sup>-1</sup> yr<sup>-1</sup> as concerns cork, 37 euro ha<sup>-1</sup> yr<sup>-1</sup> as concerns carbon sequestration and 261 euro ha<sup>-1</sup> yr<sup>-1</sup> as concerns water yield. The value of cork production on an 11-year cycle equals 1023 euro ha<sup>-1</sup> on average. The total economic production values among the tested silvicultural alternatives have proven to be characterized by relatively small differences, due to the trade-offs among the considered goods and services. Therefore, at least under conditions similar to those surveyed, managers may safely rely on different stand density options, without any relevant detrimental effect on total economic production. The tested spatial visualization of the economic values of goods and services production can be useful in supporting forest management planning, e.g., to identify priority areas in order to maximize ecosystem production for local communities. The approach proposed here and tested to this end proves to be readily applicable to other cork contexts with similar characteristics under Mediterranean conditions. © SISEF.
Quantitative changes of forest landscapes over the last century across Italy
Mostra abstract
A key topic in landscape ecology and vegetation science is the quantitative analysis of changes in forest cover over time, through the use of geomatics monitoring tools. Ecologists and landscape researchers are pointing out that a full understanding of ecosystems and landscapes should be based on the analysis of their functioning over long time series. Under this perspective, a long-term historical reconstruction of forest cover is essential. This study has aimed at examining the long-term dynamics of forest landscapes in Italy, over the last century, using recent remote-sensing based map (2012) and an accurate historical map (1936). A forest-non forest approach has been followed by the computation of a variety of landscape metrics using two analysis tools, with the final objective of quantifying changes in forest cover patterns and in the composition of specific landscape elements. Results show that forest landscape structure has significantly changed across Italy, resulting in a general trend of decreasing fragmentation and patchiness, mainly through enlargement of existing forest patches, which have also assumed a more geometrically regular shape. In relative terms, the greatest expansion of forest areas has occurred mainly in lowland districts characterised by the highest level of human pressure in the country. © 2017 Società Botanica Italiana.
Inference on forest attributes and ecological diversity of trees outside forest by a two-phase inventory
Marchetti
,
Marco
,
Garfì
,
Vittorio
,
Pisani
,
Caterina
,
Franceschi
,
Sara
,
Marcheselli
,
Marzia
,
Corona
,
P.
,
Puletti
,
Nicola
,
Vizzarri
,
Matteo
,
Di Cristofaro
,
Marco
,
Ottaviano
,
Marco
,
Fattorini
,
Lorenzo
Mostra abstract
Key message: Trees outside forests (TOF) have crucial ecological and social-economic roles in rural and urban contexts around the world. We demonstrate that a large-scale estimation strategy, based on a two-phase inventory approach, effectively supports the assessment of TOF’s diversity and related climate change mitigation potential. Context: Although trees outside forest (TOF) affect the ecological quality and contribute to increase the social and economic developments at various scales, lack of data and difficulties to harmonize the known information currently limit their integration into national and global forest inventories. Aims: This study aims to develop and test a large-scale estimation framework to assess ecological diversity and above-ground carbon stock of TOF. Methods: This study adopts a two-phase inventory approach. Results: In the surveyed territory (Molise region, Central Italy), all the attributes considered (tree abundance, basal area, wood volume, above-ground carbon stock) are concentrated in a few dominant species. Furthermore, carbon stock in TOF above-ground biomass is non-negligible (on average: 28.6 t ha<sup>−1</sup>). Compared with the low field sampling effort (0.08% out of 52,796 TOF elements), resulting uncertainty of the estimators are more than satisfactory, especially those regarding the diversity index estimators (relative standard errors < 10%). Conclusion: The proposed approach can be suitably applied on vast territories to support landscape planning and maximize ecosystem services balance from TOF. © 2018, INRA and Springer-Verlag France SAS, part of Springer Nature.
A spatio-temporal dataset of forest mensuration for the analysis of tree species structure and diversity in semi-natural mixed floodplain forests
Fardusi
,
Most Jannatul
,
Castaldi
,
Cristiano
,
Chianucci
,
Francesco
,
Corona
,
P.
,
Mason
,
Franco
,
Minari
,
Emma
,
Puletti
,
Nicola
Integrating terrestrial and airborne laser scanning for the assessment of single-tree attributes in Mediterranean forest stands
Giannetti
,
Francesca
,
Puletti
,
Nicola
,
Quatrini
,
Valerio
,
Travaglini
,
Davide
,
Bottalico
,
Francesca
,
Corona
,
P.
,
Chirici
,
Gherardo
Mostra abstract
The development of laser scanning technologies has gradually modified methods for forest mensuration and inventory. The main objective of this study is to assess the potential of integrating ALS and TLS data in a complex mixed Mediterranean forest for assessing a set of five single-tree attributes: tree position (TP), stem diameter at breast height (DBH), tree height (TH), crown base height (CBH) and crown projection area radii (CPAR). Four different point clouds were used: from ZEB1, a hand-held mobile laser scanner (HMLS), and from FARO® FOCUS 3D, a static terrestrial laser scanner (TLS), both alone or in combination with ALS. The precision of single-tree predictions, in terms of bias and root mean square error, was evaluated against data recorded manually in the field with traditional instruments. We found that: (i) TLS and HMLS have excellent comparable performances for the estimation of TP, DBH and CPAR; (ii) TH was correctly assessed by TLS, while the accuracy by HMLS was lower; (iii) CBH was the most difficult attribute to be reliably assessed and (iv) the integration with ALS increased the performance of the assessment of TH and CPAR with both HMLS and TLS. © 2018, © 2018 The Author(s). Published by Informa UK Limited, trading as Taylor & Francis Group.
Use of Sentinel-2 for forest classification in Mediterranean environments
random forest
european forest types
forest classification
jeffries-matusita (j-m) distance test
multispectral satellite imagery
Mostra abstract
Spatially-explicit information on forest composition provides valuable information to fulfil scientific, ecological and management objectives and to monitor multiple changes in forest ecosystems. The recently developed Sentinel-2 (S2) satellite imagery holds great potential for improving the classification of forest types at medium-large scales due to the concurrent availability of multispectral bands with high spatial resolution and quick revisit time. In this study, we tested the ability of S2 for forest type mapping in a Mediterranean environment. Three operational S2 images covering different phenological periods (winter, spring, summer) were processed and analyzed. Ten 10 m and 20 m bands available from S2 and four vegetation indices (VIs) were used to evaluate the ability of S2 to discriminate forest categories (conifer, broadleaved and mixed forests) and four forest types (beech forests; mixed spruce-fir forests; chestnut forests; mixed oak forests). We found that a single S2 image acquired in summer cannot discriminate neither the considered forest categories nor the forest types and therefore multitemporal images collected at different phenological periods are required. The best configuration yielded an accuracy > 83% in all considered forest types. We conclude that S2 can represent an effective option for repeated forest monitoring and mapping. © 2018 Centro di Ricerca per la Selvicoltura Consiglio per la Ricerca in Agricoltura e l'Analisi dell'Economia Agraria. All rights reserved.
Above-ground biomass prediction by Sentinel-1 multitemporal data in central Italy with integration of ALOS2 and Sentinel-2 data
Vaglio Laurin
,
Gaia
,
Balling
,
Johannes
,
Corona
,
P.
,
Mattioli
,
Walter
,
Papale
,
Dario
,
Puletti
,
Nicola
,
Rizzo
,
Maria
,
Truckenbrodt
,
John
,
Urban
,
Marcel
Mostra abstract
The objective of this research is to test Sentinel-1 SAR multitemporal data, supported by multispectral and SAR data at other wavelengths, for fine-scale mapping of above-ground biomass (AGB) at the provincial level in a Mediterranean forested landscape. The regression results indicate good accuracy of prediction (R2=0.7) using integrated sensors when an upper bound of 400Mg ha-1 is used in modeling. Multitemporal SAR information was relevant, allowing the selection of optimal Sentinel-1 data, as broadleaf forests showed a different response in backscatter throughout the year. Similar accuracy in predictions was obtained when using SAR multifrequency data or joint SAR and optical data. Predictions based on SAR data were more conservative, and in line with those from an independent sample from the National Forest Inventory, than those based on joint data types. The potential of S1 data in predicting AGB can possibly be improved if models are developed per specific groups (deciduous or evergreen species) or forest types and using a larger range of ground data. Overall, this research shows the usefulness of Sentinel-1 data to map biomass at very high resolution for local study and at considerable carbon density. © The Authors. Published by SPIE under a Creative Commons Attribution 3.0 Unported License. Distribution or reproduction of this work in whole or in part requires full attribution of the original publication, including its DOI.
Deadwood distribution in European forests
Mostra abstract
National forest inventories are a primary source of data for the assessment of forest resources and lastly more often biodiversity at national scales. The diversity of adopted sampling designs and measurements reduces the prospect for a reliable comparison of generated estimates. The ICP Forest dataset represents a unique opportunity for a standardized approach of forest estimates through Europe. This work aims to provide a distribution map of the mean deadwood volume in European forest. A total of 3243 ICP Forests plots were analysed and presented. The study area extends over 3,664,576 km<sup>2</sup> interesting 19 countries. We observed that the highest percentage of plots show a deadwood volume lower than 50 m<sup>3</sup> ha<sup>-1</sup>, with a few of forests attaining around the maximum of 300 m<sup>3</sup> ha<sup>-1</sup>. Forests with more than 100 m<sup>3</sup> ha<sup>-1</sup> are concentrated in mountainous regions, central Europe and other regions, linked to high-forest management types, while coppices-derived forest systems (part of the Great Britain, Mediterranean region) show lower deadwood content. The map of deadwood volume on European Forests is of interests for scientists, land planners, forest managers and decision-makers, as a reference for further evaluation of changes, stratified sampling, ground reference for model validation, restoration and conservation purposes. © 2017 The Author(s).
Above ground biomass and tree species richness estimation with airborne lidar in tropical Ghana forests
Vaglio Laurin
,
Gaia
,
Puletti
,
Nicola
,
Chen
,
Qi
,
Corona
,
P.
,
Papale
,
Dario
,
Valentini
,
Riccardo
Mostra abstract
Estimates of forest aboveground biomass are fundamental for carbon monitoring and accounting; delivering information at very high spatial resolution is especially valuable for local management, conservation and selective logging purposes. In tropical areas, hosting large biomass and biodiversity resources which are often threatened by unsustainable anthropogenic pressures, frequent forest resources monitoring is needed. Lidar is a powerful tool to estimate aboveground biomass at fine resolution; however its application in tropical forests has been limited, with high variability in the accuracy of results. Lidar pulses scan the forest vertical profile, and can provide structure information which is also linked to biodiversity. In the last decade the remote sensing of biodiversity has received great attention, but few studies focused on the use of lidar for assessing tree species richness in tropical forests. This research aims at estimating aboveground biomass and tree species richness using discrete return airborne lidar in Ghana forests. We tested an advanced statistical technique, Multivariate Adaptive Regression Splines (MARS), which does not require assumptions on data distribution or on the relationships between variables, being suitable for studying ecological variables. We compared the MARS regression results with those obtained by multilinear regression and found that both algorithms were effective, but MARS provided higher accuracy either for biomass (R<sup>2</sup> = 0.72) and species richness (R<sup>2</sup> = 0.64). We also noted strong correlation between biodiversity and biomass field values. Even if the forest areas under analysis are limited in extent and represent peculiar ecosystems, the preliminary indications produced by our study suggest that instrument such as lidar, specifically useful for pinpointing forest structure, can also be exploited as a support for tree species richness assessment. © 2016 Elsevier B.V.
Checking the performance of point and plot sampling on aerial photoimagery of a large-scale population of trees outside forests
Fattorini
,
Lorenzo
,
Puletti
,
Nicola
,
Chirici
,
Gherardo
,
Corona
,
P.
,
Gazzarri
,
C.
,
Mura
,
Matteo
,
Marchetti
,
Marco
tessellation stratified sampling
two-phase sampling
design-based estimation
one-per-stratum stratified sampling
Mostra abstract
The present study investigates some sampling strategies for the estimation of abundance and canopy cover of trees outside forest (TOF) over large areas. A collection of about 53 000 TOF units in Central Italy was acquired by visual, on-screen interpretation of aerial orthophotos and was taken as the reference population with the purpose of investigating: (i) one-phase inventories with sample points located by means of the tessellation stratified sampling (TSS), which involves covering the study region by a grid of regular polygons of equal sizes and randomly and independently selecting a point in each of them; (ii) two-phase inventories with the one-per-stratum stratified sampling adopted in the second phase to select a sample of polygons from the grid and then visit only the points contained in those polygons. Uniform random sampling is also considered in the first phase as a benchmark for tessellation stratified sampling. The sampling schemes adopted to select TOF units at the sample points are as follows: (i) point sampling, (ii) centroid-based plot sampling with plot radius of 50m(CPLS50) or 100 m, and (iii) plot intersect sampling with plot radius of 50 or 100 m. CPLS50 under single-phase TSS proves to be a promising strategy to large-scale TOF inventories. © 2016, Canadian Science Publishing. All rights reserved.
Evaluating EO1-Hyperion capability for mapping conifer and broadleaved forests
random forest
mediterranean areas
hyperspectral images
image classification
multivariate adaptive regression splines
support vector machine
Mostra abstract
The objective of the present study is the comparison of the combined use of Earth Observation-1 (EO-1) Hyperion Hyperspectral images with the Random Forest (RF), Support Vector Machines (SVM) and Multivariate Adaptive Regression Splines (MARS) classifiers for discriminating forest cover groups, namely broadleaved and coniferous forests. Statistics derived from classification confusion matrix were used to assess the accuracy of the derived thematic maps. We demonstrated that Hyperion data can be effectively used to obtain rapid and accurate large-scale mapping of main forest types (conifers-broadleaved). We also verified higher capability of Hyperion imagery with respect to Landsat data to such an end. Results demonstrate the ability of the three tested classification methods, with small improvements given by SVM in terms of overall accuracy and kappa statistic. © 2016 by the authors; licensee Italian Society of Remote Sensing (AIT).
Discrimination of tropical forest types, dominant species, and mapping of functional guilds by hyperspectral and simulated multispectral Sentinel-2 data
Vaglio Laurin
,
Gaia
,
Puletti
,
Nicola
,
Hawthorne
,
William D.
,
Liesenberg
,
Veraldo
,
Corona
,
P.
,
Papale
,
Dario
,
Chen
,
Qi
,
Valentini
,
Riccardo
Mostra abstract
To answer new scientific and ecological questions and monitor multiple forest changes, a fine scale characterization of these ecosystems is needed, and could imply the mapping of specific species, of detailed forest types, and of functional composition. This characterization can be now provided by the novel Earth Observation tools. This study aims to contribute to understanding the innovation in forest and ecological research that can be brought in by advanced remote sensing instruments, and proposes the guild mapping approach as a tool to efficiently monitor the varied tropical forest resources. We evaluated, in tropical Ghanaian forests, the ability of airborne hyperspectral and simulated multispectral Sentinel-2 data, and derived vegetation indices and textures, to: distinguish between two different forest types; to discriminate among selected dominant species; and to separate trees species grouped according to their functional guilds: Pioneer, Non Pioneer Light Demanding, and Shade Bearer. We then produced guild classification maps for each area using hyperspectral data. Our results showed that with both hyperspectral and simulated Sentinel-2 data these discrimination tasks can be successfully accomplished. Results also stressed the importance of texture features, especially if using the lower spectral and spatial Sentinel-2 resolution data, and highlighted the important role of the new Sentinel-2 data for ecological monitoring. Classification results showed a statistically significant improvement in overall accuracy using Support Vector Machine, over Maximum Likelihood approach. We proposed the functional guilds mapping as an innovative approach to: (i) monitor compositional changes, especially with respect to the effects of global climate change on forests, and particularly in the tropical biome where the occurrence of hundreds of species prevents mapping activities at species level; (ii) support large-scale forest inventories. The imminent Sentinel-2 data could serve to open the road for the development of new concepts and methods in forestry and ecological research. © 2016 Elsevier Inc.
Quantifying the effect of sampling plot size on the estimation of structural indicators in old-growth forest stands
Lombardi
,
Fabio
,
Marchetti
,
Marco
,
Corona
,
P.
,
Merlini
,
Paolo
,
Chirici
,
Gherardo
,
Tognetti
,
Roberto
,
Burrascano
,
Sabina
,
Alivernini
,
Alessandro
,
Puletti
,
Nicola
Mostra abstract
There is increasing awareness that structure-based indicators should be considered for assessing the biological value of late successional forests. In order to increase the unique habitat features critical for old-growth associated species, it is important to identify and rank candidate potential forest sites on the basis of their distinctive structural features. Data on living and deadwood components for the identification of old-growth condition are usually acquired in the considered forest stands by two sampling survey: (i) census performed in relatively large monitoring sites; (ii) network of small sampling units, on which inventory practices are usually based. Several authors argued that choosing between these survey strategies might have substantial effects on the values of common indicators of old-growth condition. Our study aims at (i) assessing the total estimate differences among old-growth structural indicators measured in field plots with different sizes, and (ii) defining the optimal sample size for the reliable assessment of such indicators. The study was carried out in six beech dominated forest stands on the Apennines range in Italy. In each stand, living and deadwood components were surveyed and geocoded in 1-ha square areas. Based on these dataset, circular plots with radii ranging from 4m up to 20m were then considered in order to quantify the effect of sampling plot size on the estimation of four structural indicators: (1) number of living trees; (2) number of large trees (dbh≥50cm); (3) total deadwood volume; (4) number of deadwood elements (snags, dead standing trees; lying dead trees, lying deadwood) with dbh (or average diameter for lying deadwood) ≥ 30cm. We found that the size of the sampling plots should be at least 500 m<sup>2</sup> in order to establish a database for the assessment of the investigated indicators. The census approach should be preferred to the sampling plot approach for old-growth forest stands smaller than 3-5ha. The achieved results contribute to define assessment protocols for characterizing and ranking the degree to which forest stands approximate old-growth condition based on standardized indicators. © 2015 Elsevier B.V.
Prediction of forest NPP in Italy by the combination of ground and remote sensing data
Chirici
,
Gherardo
,
Chiesi
,
Marta
,
Corona
,
P.
,
Puletti
,
Nicola
,
Mura
,
Matteo
,
Maselli
,
Fabio
Mostra abstract
Our research group has recently proposed a strategy to simulate net forest carbon fluxes based on the coupling of a NDVI-driven parametric model, Modified C-Fix, and of a biogeochemical model, BIOME-BGC. The outputs of the two models are combined through the use of a proxy of ecosystem distance from equilibrium condition which accounts for the occurred disturbances. This modeling strategy is currently applied to all Italian forest areas using an available set of NDVI images and ancillary data descriptive of an 8-year period (1999–2006). The obtained estimates of forest net primary production (NPP) are first analyzed in order to assess the importance of the main model drivers on relevant spatial variability. This analysis indicates that growing stock is the most influential model driver, followed by forest type and meteorological variables. In particular, the positive influence of growing stock on NPP can be constrained by thermal and water limitations, which are most evident in the upper mountain and most southern zones, respectively. Next, the NPP estimates, aggregated over seven main forest types and twenty administrative regions in Italy, are converted into current annual increment of standing volume (CAI) by specific coefficients. The accuracy of these CAI estimates is finally assessed by comparison with the ground data collected during a recent national forest inventory. The results obtained indicate that the modeling approach tends to overestimate the ground CAI for most forest types. In particular, the overestimation is notable for forest types which are mostly managed as coppice, while it is negligible for high forests. The possible origins of these phenomena are investigated by examining the main model drivers together with the results of previous studies and of older forest inventories. The implications of using different NPP estimation methods are finally discussed in view of assessing the forest carbon budget on a national basis. © 2015, Springer-Verlag Berlin Heidelberg.
Integrated forest management to prevent wildfires under mediterranean environments
Corona
,
P.
,
Ascoli
,
Davide
,
Barbati
,
Anna
,
Bovio
,
Giovanni
,
Colangelo
,
Giuseppe
,
Elia
,
Mario
,
Garfì
,
Vittorio
,
Iovino
,
Francesco
,
Lafortezza
,
Raffaele
,
Leone
,
Vittorio
,
Lovreglio
,
Raffella
,
Marchetti
,
Marco
,
Marchi
,
Enrico
,
Menguzzato
,
Giuliano
,
Nocentini
,
Susanna
,
Picchio
,
Rodolfo
,
Portoghesi
,
Luigi
,
Puletti
,
Nicola
,
Sanesi
,
Giovanni
,
Chianucci
,
Francesco
Mostra abstract
This review presents a multidisciplinary framework for integrating the ecological, regulatory, procedural and technical aspects of forest management for fires prevention under Mediterranean environments. The aims are to: i) provide a foreground of wildfire scenario; ii) illustrate the theoretical background of forest fuel management; iii) describe the available fuel management techniques and mechanical operations for fire prevention in forest and wildland-urban interfaces, with exemplification of case-studies; iv) allocate fire prevention activities under the hierarchy of forest planning. The review is conceived as an outline commentary discussion targeted to professionals, technicians and government personnel involved in forestry and environmental management.
Estimation of leaf area index in isolated trees with digital photography and its application to urban forestry
Mostra abstract
Accurate estimates of leaf area index (L) are strongly required for modelling ecophysiological processes within urban forests. The majority of methods available for estimating L is ideally applicable at stand scale and is therefore poorly suitable in urban settings, where trees are typically sparse and isolated. In addition, accurate measurements in urban settings are hindered by proximity of trees to infrastructure elements, which can strongly affect the accuracy of tree canopy analysis.In this study we tested whether digital photography can be used to obtain indirect estimate of L of isolated trees. The sampled species were Platanus orientalis, Liquidambar styraciflua and Juglans regia. Upward-facing photography was used to estimate gap fraction and foliage clumping from images collected in unobstructed (open areas) and obstructed (nearby buildings) settings; two image classification methods provided accurate estimates of gap fraction, based on comparison with measurements obtained from a high quality quantum sensor (LAI-2000). Leveled photography was used to characterize the leaf angle distribution of the examined tree species. L estimates obtained combining the two photographic methods agreed well with direct L measurements obtained from harvesting. We conclude that digital photography is suitable for estimating leaf area in isolated urban trees, due to its simple, fast and cost-effective procedures. Use of vegetation indices allows extending significantly the applicability of the photographic method in urban settings, including green roofs and vertical greenery systems. © 2015 Elsevier GmbH.
Estimation of leaf area index in understory deciduous trees using digital photography
foliage cover
digital nadir photography
foliage projection coefficient
leaf angle distribution
leveled camera
Mostra abstract
Fast and accurate estimates of understory leaf area are essential to a wide range of ecological applications. Indirect methods have mainly been used to estimate leaf area of overstory but their application in understory remains largely unexplored. In this study we described a combination of digital photographic methods to obtain rapid, reliable and non-destructive estimate of leaf area index of understory deciduous trees. Nadir photography was used to estimate foliage cover, vertical gap fraction and foliage clumping index. Leveled photography was used to characterize the leaf angle distribution of the examined tree species. Leaf area index estimates obtained combining the two photographic methods were compared with direct measurements obtained from harvesting (. L).We applied these methods in Quercus cerris, Carpinus betulus and Fagus sylvatica stands. Foliage cover estimates derived from two nadir image classification methods were significantly correlated with leaf area index measurements obtained from harvesting. The leveled digital photographic method, previously tested in tall trees and field crops, provided reliable leaf angle measurements in understory tree species. Digital photography provided good indirect estimates of L. We conclude that digital photography is suitable for routine estimate and monitoring of understory leaf area, on account of its fast and cost-effective procedure. © 2014 Elsevier B.V.
Unsupervised classification of very high remotely sensed images for grapevine rows detection
Mostra abstract
In viticulture, knowledge of vineyard vigour represents a useful tool for management. Over large areas, the grapevine vigour is mapped by remote sensing usually with vegetation indices like NDVI. To achieve good correlations between NDVI and other vine parameters the rows of a vineyard must be previously identified. This paper presents an unsupervised classification method for the identification of grapevine rows. Only the red channel of an RGB aerial image is considered as input data. The image is first masked preserving only the considered vineyard and then pre-processed with a high pass filter. The pixel populations are split in "row" and "inter-row" subset through a Ward's modified technique. The proposed methodology is compared with standard object oriented procedure tested on six vineyards located in Tuscany using as reference manually digitalized vine rows.
Is randomized branch sampling suitable to assess wood volume of temperate broadleaved old-growth forests?
Chirici
,
Gherardo
,
Puletti
,
Nicola
,
Salvati
,
Riccardo
,
Arbi
,
Francesco
,
Zolli
,
Catherine
,
Corona
,
P.
precision
horvitz-thompson estimation
old-growth
randomized branch sampling
simulation
tree climbing
Mostra abstract
Old-growth forests are characterized by the presence of large and very large trees. The estimation of their wood volume and biomass is essential in order to monitor the ecological processes in these stands and their contribution to carbon cycle. However, conventional wood volume estimation techniques based on mensuration of stem diameter at breast height and tree height is most often unfeasible for large and very large trees in old-growth forests because volume models or tables are usually elaborated from trees of smaller size grown up in regularly managed forest stands. Random Branch Sampling (RBS) is often proposed as a possible estimation alternative under such conditions. Starting from the ground level some of the parts of the main trunk and of the branches are sampled and measured to estimate the overall wood volume (or other biophysical variables). The application of RBS in old-growth forests, where tree cutting is usually forbidden or very difficult, requires that the crown of the tree can physically be reached to measure the sampled parts. We argue that under such conditions it is usually preferable to fully measure all the components of the tree crown because RBS estimates are not precise if based on only one sampling path and that, on the other hand, measuring the main trunk and all the branches by tree-climbing consumes the same time as replicating several RBS paths on the same tree. To demonstrate our hypothesis we selected 16 large beech trees located in the old-growth forest of Mount Cimini in Central Italy. Using a modern tree-climbing approach the main trunk and all the branches were measured and recorded in the field. The database was used to simulate RBS paths. Real values from volume census were contrasted with estimates based on RBS. On the whole, RBS estimates based on one single path prove to be highly imprecise. Even for trees characterized by a rather regular form, at least three RBS paths should be repeated on the same tree to maintain the relative standard error under or near 15%. This paper introduces the problem and describes the experimental test. The results are discussed under the perspective of standardized application of the proposed methodology. © 2013 Elsevier B.V.
Photographic assessment of overstory and understory leaf area index in beech forests under different management regimes in Central Italy: Short communication
Mostra abstract
Forest understory may be strongly affected by silvicultural practices such as thinning, which simultaneously modulates the overstory canopy cover and influences the availability of light. However, the understory layer is rarely considered in management decisions, partly because methods to estimate understory leaf area index are poorly developed. In this study we used two different restricted view angle photographic methods to estimate overstory plant area index L<inf>O</inf> (zenith cover photography), understory leaf area index L<inf>U</inf> (nadir cover photography) and their related canopy attributes (foliage clumping, foliage cover, crown cover, crown porosity). These measurements were performed in beech stands under different management regime. Results from photography indicated that not only overstory but also understory canopy attributes were significantly influenced by forest management. In addition, a significant negative correlation was found between L<inf>O</inf> and L<inf>U</inf>. We conclude that the photographic methods are effective for monitoring (overstory and understory) canopy status in managed stands, on account of their rapid and not destructive procedures, which allows large scale implementation of the methods. © 2014 Estonian University of Life Sciences. All rights reserved.
Early impact of alternative thinning approaches on structure diversity and complexity at stand level in two beech forests in Italy
Becagli
,
Claudia
,
Puletti
,
Nicola
,
Chiavetta
,
U.
,
Cantiani
,
Paolo
,
Salvati
,
Luca
,
Fabbio
,
Gianfranco
Mostra abstract
Stand structure, tree density as well as tree spatial pattern define natural dynamics and competition process. They are therefore parameters used to define any silvicultural management type. This work aims to report first data resulting from a silvicultural experiment in beech forests. The objective of the trial is testing the structure manipulation in terms of diversity and the reduction of inter-tree competition of different thinning approaches. Alternative thinning methods have been applied in two independent experimental sites located in the pre-Alps and southern Apennines, in Italy. Specific goals were to: (i) verify the impact early after thinning implementation on forest structure through a set of diversity and competition metrics resulting from a literature review; (ii) the sensitivity of tested indexes to detect effectively thinning manipulation. Main results show the low sensitivity of stand structure indexes and the ability of competition metrics to detect thinning outcome.
Evaluating the effects of environmental changes on the gross primary production of Italian forests
Maselli
,
Fabio
,
Moriondo
,
Marco
,
Chiesi
,
Marta
,
Chirici
,
Gherardo
,
Puletti
,
Nicola
,
Barbati
,
Anna
,
Corona
,
P.
Mostra abstract
A ten-year data-set descriptive of Italian forest gross primary production (GPP) has been recently constructed by the application of Modified C-Fix, a parametric model driven by remote sensing and ancillary data. That data-set is currently being used to develop multivariate regression models which link the inter-year GPP variations of five forest types (white fir, beech, chestnut, deciduous and evergreen oaks) to seasonal values of temperature and precipitation. The five models obtained, which explain from 52% to 88% of the interyear GPP variability, are then applied to predict the effects of expected environmental changes (+2 °C and increased CO<inf>2</inf> concentration). The results show a variable response of forest GPP to the simulated climate change, depending on the main ecosystem features. In contrast, the effects of increasing CO<inf>2</inf> concentration are always positive and similar to those given by a combination of the two environmental factors. These findings are analyzed with reference to previous studies on the subject, particularly concerning Mediterranean environments. The analysis confirms the plausibility of the scenarios obtained, which can cast light on the important issue of forest carbon pool variations under expected global changes. © 2009 by the authors; licensee Molecular Diversity Preservation International, Basel, Switzerland.
Combining remote sensing and ancillary data to monitor the gross productivity of water-limited forest ecosystems
Mostra abstract
This paper describes the development and testing of a procedure which combines remotely sensed and ancillary data to monitor forest productivity in Italy. The procedure is based on a straightforward parametric model (C-Fix) that uses the relationship between the fraction of photosynthetically active radiation absorbed by plant canopies (fAPAR) and relevant gross primary productivity (GPP). Estimates of forest fAPAR are derived from Spot-VGT NDVI images and are combined with spatially consistent data layers obtained by the elaboration of ground meteorological measurements. The original version of C-Fix is first applied to estimate monthly GPP of Italian forests during eight years (1999-2006). Next, a modification of the model is proposed in order to simulate the short-term effect of summer water stress more efficiently. The accuracy of the original and modified C-Fix versions is evaluated by comparison with GPP data taken at eight Italian eddy covariance flux tower sites. The experimental results confirm the capacity of C-Fix to monitor national forest GPP patterns and indicate the utility of considering the short-term effect of water stress during Mediterranean dry months. © 2008 Elsevier Inc. All rights reserved.