Loading...
Pubblicazioni Scientifiche
Filtri di ricerca 6 risultati
Pubblicazioni per anno
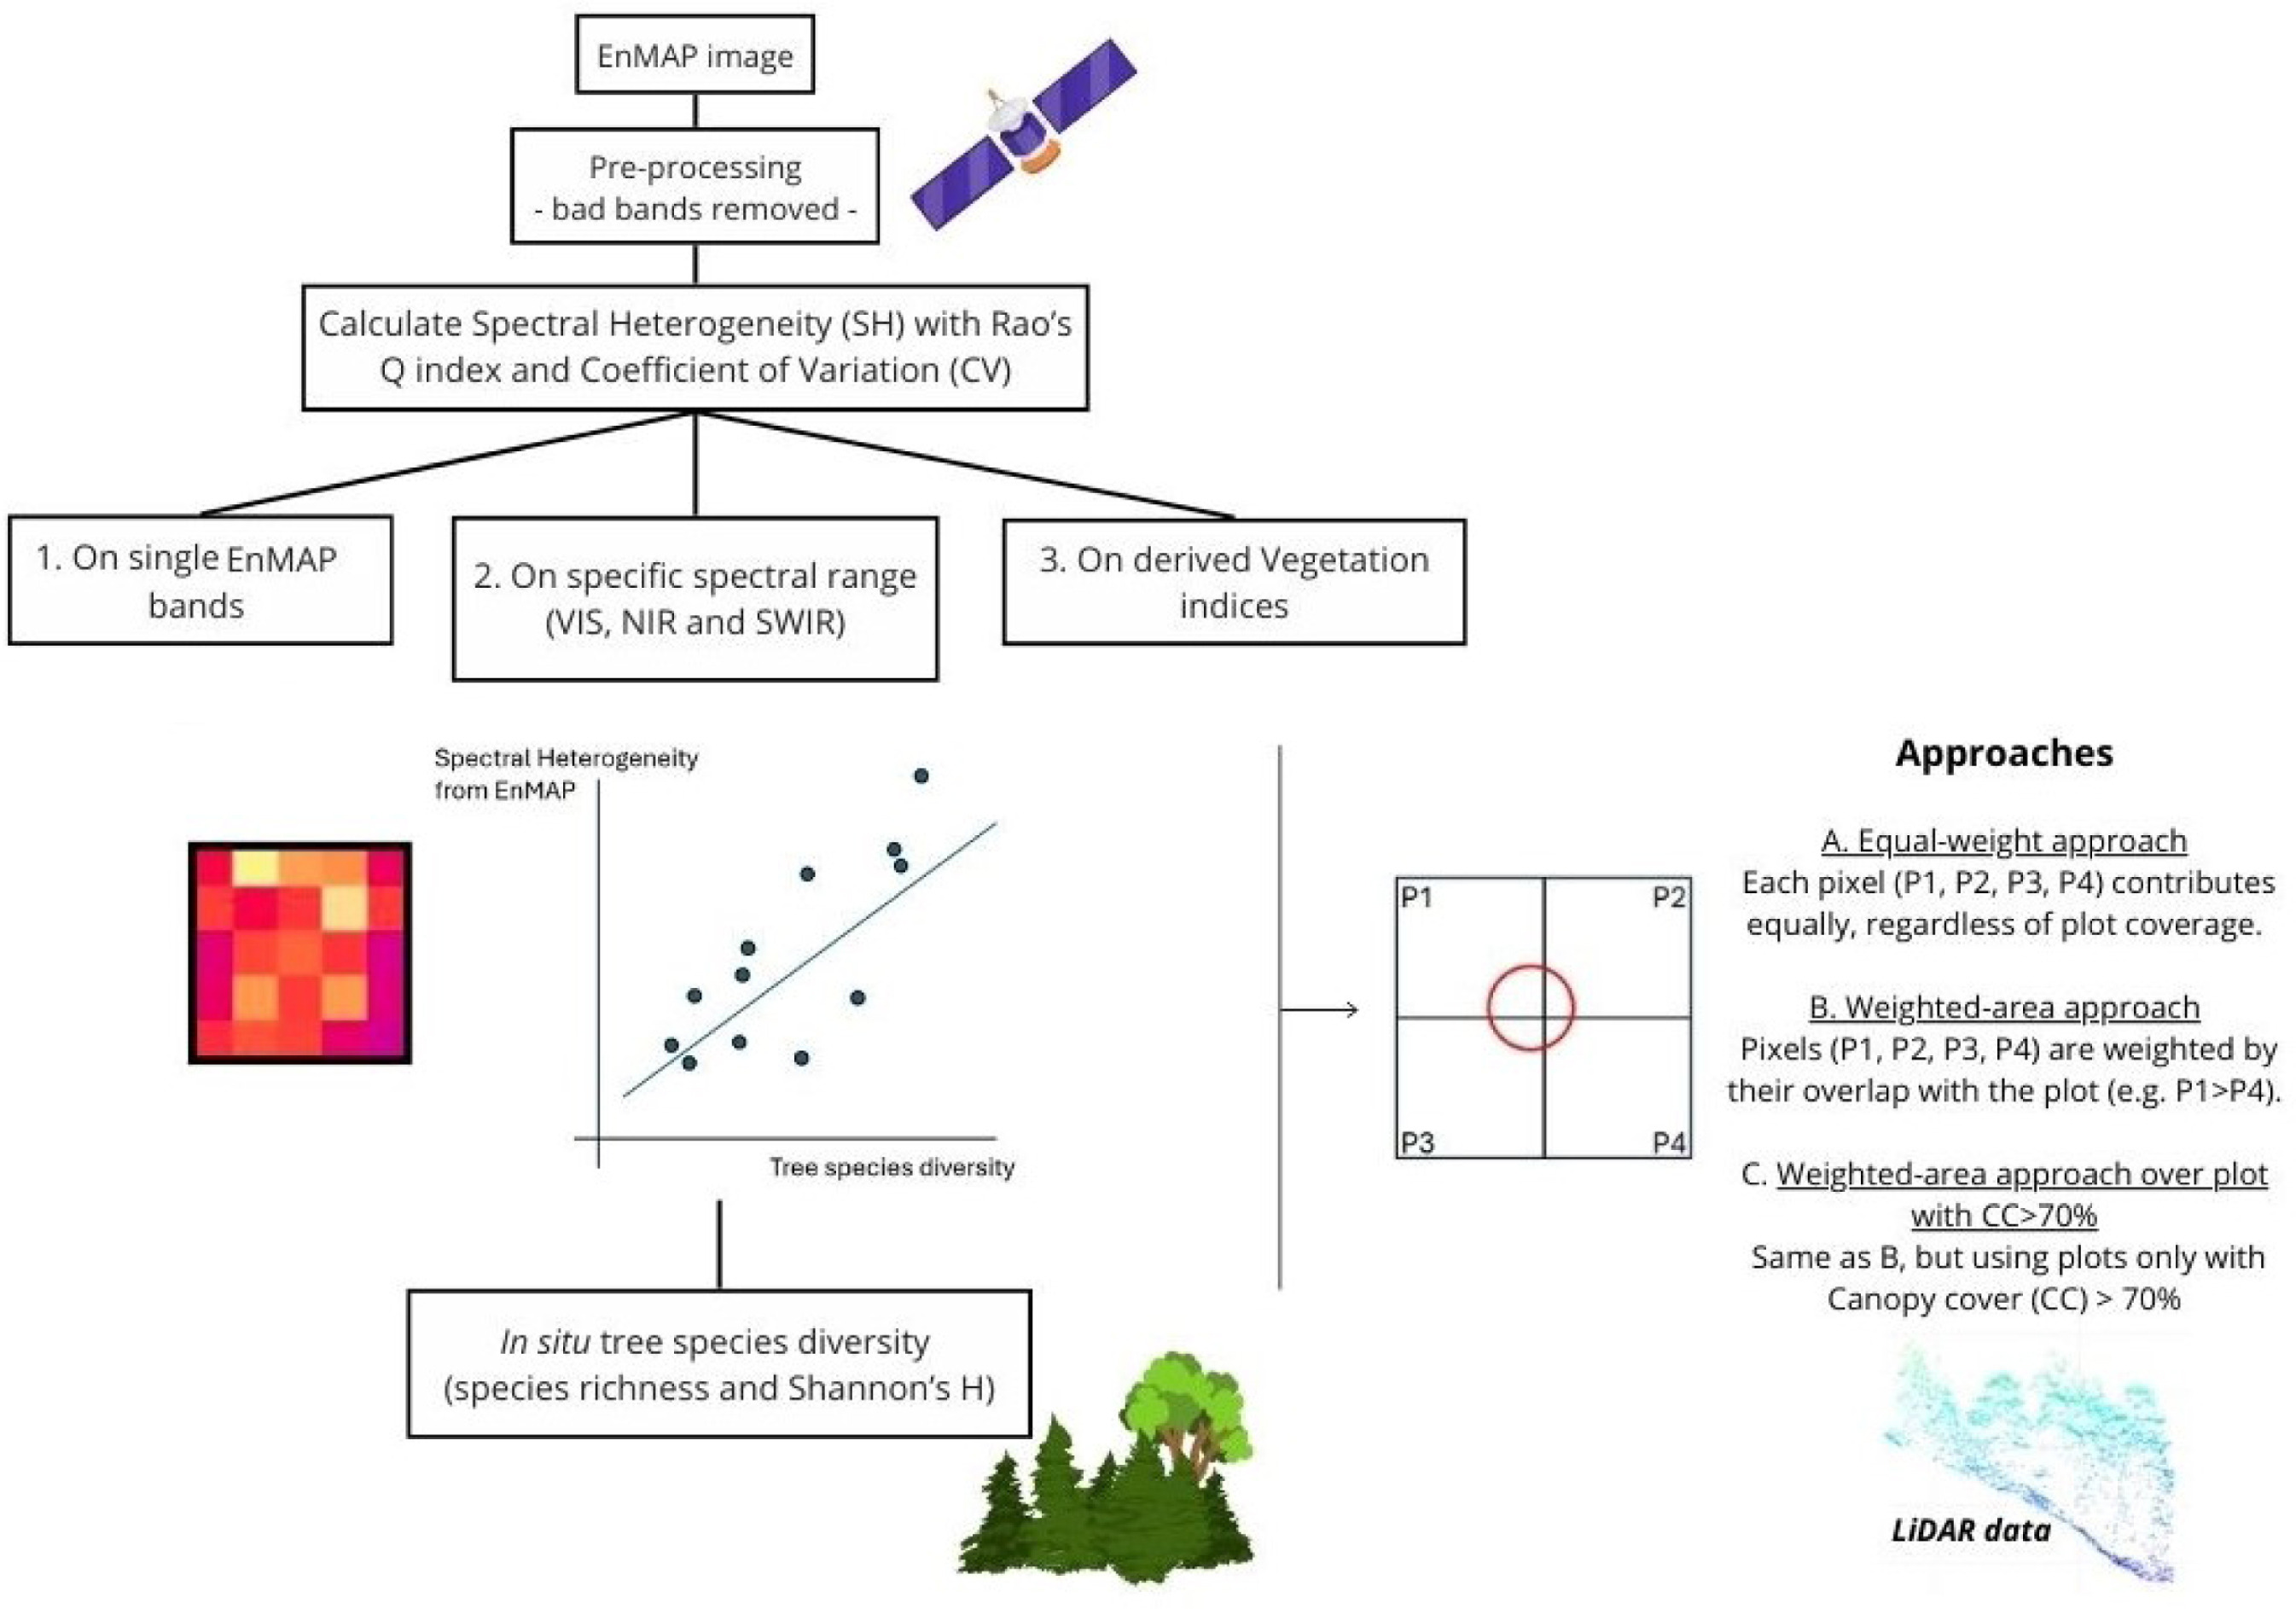
Spectral heterogeneity from the spaceborne imaging spectrometer EnMAP reveals biodiversity patterns in forest ecosystems
Torresani
,
Michele
,
Rossi
,
Christian
,
Mina
,
Marco
,
Menegaldo
,
Irene
,
Cappuccio
,
Matteo
,
Perrone
,
Michela
,
Hakkenberg
,
Christopher R.
,
Rocchini
,
Duccio
,
Puletti
,
Nicola
,
Stendardi
,
Laura
,
Montagnani
,
Leonardo
,
Tognetti
,
Roberto
Mostra abstract
The Spectral Variation Hypothesis (SVH) proposes that spectral heterogeneity (SH), derived from optical data, can serve as a proxy for estimating biodiversity. In this study, we tested the SVH across 42 forest plots in the Italian Alps using imaging spectroscopy data from the EnMAP satellite. We investigated the relationship between SH—quantified using two different metrics, Rao's Q and the coefficient of variation (CV)—and tree species diversity (using Shannon's H index and species richness). We applied three levels of spectral analysis: (1) SH calculated for each individual EnMAP band; (2) SH aggregated across broader spectral ranges (Visible -VIS-, Near Infrared -NIR-, and Shortwave Infrared -SWIR-) and (3) SH derived from vegetation indices (VIs). These analyses were performed under three spatial approaches: (A) a normal approach assigning equal weight to all four EnMAP pixels intersecting a plot; (B) a weighted approach based on the proportional overlap of each pixel with the plot area; and (C) a weighted canopy cover (CC)>70% approach, which included only plots with CC greater than 70% as derived from airborne laser scanning (ALS) LiDAR data. Weak to moderate correlations were observed when SH was derived from single bands, with the strongest relationships in the NIR (R<sup>2</sup> approaching 0.4), followed by the VIS and SWIR regions. A similar trend emerged when SH was aggregated across broader spectral ranges, with the highest correlations again found in the NIR (R<sup>2</sup> up to 0.35). In contrast, lower R<sup>2</sup> values were obtained when SH was computed from specific VIs. The weighted approaches, especially when restricted to plots with CC >70%, consistently yielded higher R<sup>2</sup> values than the equal-weight approach in all three the spectral analysis. Results were consistent across both SH metrics (Rao's Q and CV), with stronger correlations when species richness was used as the biodiversity metric. This work highlights how EnMAP hyperspectral data, despite inherent constraints, can provide valuable insights into forest biodiversity monitoring. © 2025 The Author(s)

Benchmarking tree species classification from proximally sensed laser scanning data: Introducing the FOR-species20K dataset
Puliti
,
Stefano
,
Lines
,
Emily R.
,
Müllerová
,
Jana
,
Frey
,
Julian
,
Schindler
,
Zoe
,
Straker
,
Adrian
,
Allen
,
Matthew J.
,
Winiwarter
,
Lukas
,
Rehush
,
Nataliia
,
Hristova
,
Hristina S.
,
Murray
,
Brent A.
,
Calders
,
Kim
,
Coops
,
Nicholas C.
,
Höfle
,
Bernhard
,
Irwin
,
Liam A.K.
,
Junttila
,
Samuli
,
Kruček
,
Martin
,
Krok
,
G.
,
Král
,
Kamil
,
Levick
,
Shaun R.
,
Lück
,
Linda
,
Missarov
,
Azim
,
Mokroš
,
M.
,
Owen
,
Harry Jon Foord
,
Stereńczak
,
Krzysztof Jan
,
Pitkänen
,
Timo P.
,
Puletti
,
Nicola
,
Saarinen
,
Ninni
,
Hopkinson
,
Chris Dennis
,
Terryn
,
Louise
,
Torresan
,
C.
,
Tomelleri
,
Enrico
,
Weiser
,
Hannah
,
Astrup
,
Rasmus
Mostra abstract
Proximally sensed laser scanning presents new opportunities for automated forest ecosystem data capture. However, a gap remains in deriving ecologically pertinent information, such as tree species, without additional ground data. Artificial intelligence approaches, particularly deep learning (DL), have shown promise towards automation. Progress has been limited by the lack of large, diverse, and, most importantly, openly available labelled single-tree point cloud datasets. This has hindered both (1) the robustness of the DL models across varying data types (platforms and sensors) and (2) the ability to effectively track progress, thereby slowing the convergence towards best practice for species classification. To address the above limitations, we compiled the FOR-species20K benchmark dataset, consisting of individual tree point clouds captured using proximally sensed laser scanning data from terrestrial (TLS), mobile (MLS) and drone laser scanning (ULS). Compiled collaboratively, the dataset includes data collected in forests mainly across Europe, covering Mediterranean, temperate and boreal biogeographic regions. It includes scattered tree data from other continents, totaling over 20,000 trees of 33 species and covering a wide range of tree sizes and forms. Alongside the release of FOR-species20K, we benchmarked seven leading DL models for individual tree species classification, including both point cloud (PointNet++, MinkNet, MLP-Mixer, DGCNNs) and multi-view 2D-based methods (SimpleView, DetailView, YOLOv5). 2D Image-based models had, on average, higher overall accuracy (0.77) than 3D point cloud-based models (0.72). Notably, the performance was consistently >0.8 across scanning platforms and sensors, offering versatility in deployment. The top-scoring model, DetailView, demonstrated robustness to training data imbalances and effectively generalized across tree sizes. The FOR-species20K dataset represents an important asset for developing and benchmarking DL models for individual tree species classification using proximally sensed laser scanning data. As such, it serves as a crucial foundation for future efforts to classify accurately and map tree species at various scales using laser scanning technology, as it provides the complete code base, dataset, and an initial baseline representative of the current state-of-the-art of point cloud tree species classification methods. © 2025 The Author(s). Methods in Ecology and Evolution published by John Wiley & Sons Ltd on behalf of British Ecological Society.
LAIr: an R package to estimate LAI from Normalized Difference Vegetation Index
Bajocco
,
Sofia
,
Ferrara
,
Carlotta
,
Savian
,
Francesco
,
Ginaldi
,
Fabrizio
,
Puletti
,
Nicola
,
Crecco
,
Lorenzo
,
Bregaglio
,
Simone Ugo Maria
,
Chianucci
,
Francesco
Mostra abstract
Leaf area index (LAI) is an important biophysical parameter describing vegetation. LAI is typically retrieved from optical remote sensing by empirical models relating LAI to vegetation indices, such as the Normalized Difference Vegetation Index (NDVI). As the relationship between LAI and NDVI is non-linear and crop type dependant, several specific empirical equations relating LAI to NDVI have been developed using field data. This study presented LAIr, an R package to derive LAI from NDVI data from the most comprehensive library of conversion equations. In the package, the range of functions differs on environmental factors, sensors, and vegetation types, allowing flexibility in choosing appropriate options based on specific application, scale of investigation and data availability. We illustrated the use of the package with a case study to compare a generic LAI product with specific NDVI-based LAI estimations. By leveraging empirical knowledge, LAIr enables accurate and context-specific estimation of LAI. The deployment of an open-source R package serves as a valuable tool for aiding researchers in selecting the most appropriate equations for conducting NDVI-to-LAI conversion. © 2024
Wall-to-Wall Mapping of Forest Biomass and Wood Volume Increment in Italy
Giannetti
,
Francesca
,
Chirici
,
Gherardo
,
Vangi
,
Elia
,
Corona
,
P.
,
Maselli
,
Fabio
,
Chiesi
,
Marta
,
D'Amico
,
Giovanni
,
Puletti
,
Nicola
Mostra abstract
Several political initiatives aim to achieve net-zero emissions by the middle of the twenty-first century. In this context, forests are crucial as a carbon sink to store unavoidable emissions. Assessing the carbon sequestration potential of forest ecosystems is pivotal to the availability of accurate forest variable estimates for supporting international reporting and appropriate forest management strategies. Spatially explicit estimates are even more important for Mediterranean countries such as Italy, where the capacity of forests to act as sinks is decreasing due to climate change. This study aimed to develop a spatial approach to obtain high-resolution maps of Italian forest above-ground biomass (ITA-BIO) and current annual volume increment (ITA-CAI), based on remotely sensed and meteorological data. The ITA-BIO estimates were compared with those obtained with two available biomass maps developed in the framework of two international projects (i.e., the Joint Research Center and the European Space Agency biomass maps, namely, JRC-BIO and ESA-BIO). The estimates from ITA-BIO, JRC-BIO, ESA-BIO, and ITA-CAI were compared with the 2nd Italian NFI (INFC) official estimates at regional level (NUT2). The estimates from ITA-BIO are in good agreement with the INFC estimates (R<sup>2</sup> = 0.95, mean difference = 3.8 t ha<sup>−1</sup>), while for JRC-BIO and ESA-BIO, the estimates show R<sup>2</sup> of 0.90 and 0.70, respectively, and mean differences of 13.5 and of 21.8 t ha<sup>−1</sup> with respect to the INFC estimates. ITA-CAI estimates are also in good agreement with the INFC estimates (R<sup>2</sup> = 0.93), even if they tend to be slightly biased. The produced maps are hosted on a web-based forest resources management Decision Support System developed under the project AGRIDIGIT (ForestView) and represent a key element in supporting the new Green Deal in Italy, the European Forest Strategy 2030 and the Italian Forest Strategy. © 2022 by the authors.
Integrating terrestrial and airborne laser scanning for the assessment of single-tree attributes in Mediterranean forest stands
Giannetti
,
Francesca
,
Puletti
,
Nicola
,
Quatrini
,
Valerio
,
Travaglini
,
Davide
,
Bottalico
,
Francesca
,
Corona
,
P.
,
Chirici
,
Gherardo
Mostra abstract
The development of laser scanning technologies has gradually modified methods for forest mensuration and inventory. The main objective of this study is to assess the potential of integrating ALS and TLS data in a complex mixed Mediterranean forest for assessing a set of five single-tree attributes: tree position (TP), stem diameter at breast height (DBH), tree height (TH), crown base height (CBH) and crown projection area radii (CPAR). Four different point clouds were used: from ZEB1, a hand-held mobile laser scanner (HMLS), and from FARO® FOCUS 3D, a static terrestrial laser scanner (TLS), both alone or in combination with ALS. The precision of single-tree predictions, in terms of bias and root mean square error, was evaluated against data recorded manually in the field with traditional instruments. We found that: (i) TLS and HMLS have excellent comparable performances for the estimation of TP, DBH and CPAR; (ii) TH was correctly assessed by TLS, while the accuracy by HMLS was lower; (iii) CBH was the most difficult attribute to be reliably assessed and (iv) the integration with ALS increased the performance of the assessment of TH and CPAR with both HMLS and TLS. © 2018, © 2018 The Author(s). Published by Informa UK Limited, trading as Taylor & Francis Group.
Post fire natural regeneration monitoring with the integrated use of high resolution remotely sensed images: The case study of the Pineta di Castel Fusano; Monitoraggio della rinnovazione naturale post incendio tramite l'uso integrato di immagini telerilevate ad alta risoluzione: Il caso della pineta di Castel Fusano
Chirici
,
Gherardo
,
Balsi
,
Marco
,
Bertini
,
Roberta
,
Bonora
,
Nico
,
Chiavetta
,
U.
,
Ottaviano
,
Marco
,
Corona
,
P.
,
Lamonaca
,
Andrea
,
Giuliarelli
,
Diego
,
Mastronardi
,
Alessandro
,
Nardinocchi
,
Giovanni
,
Sambucini
,
Valter
,
Tonti
,
Daniela
,
Marchetti
,
Marco
remote sensing
forest wildfires
k-nearest neighbors
natural re generation
neural networks
spatialisation
Mostra abstract
Stone pine stand of Castel Fusano (Rome) burnt on July the 4th 2000 during a huge wildfire. As a consequence of the fire an intensive natural sexual and asexual regeneration began. In order to monitor such a regeneration field surveys were carried out in 2003 and 2006 in sample plots. Remotely sensed high resolution images from Ikonos and Quick Bird were acquired for the same years. The purpose of this work is to test different methodologies for modeling existing relationships between remotely sensed images and ground collected data in order to estimate and to map both sexual and asexual regeneration. For such a purpose different methodologies were tested: step-wise Muliple Linear Regression, Neural Networks (Relevance-Vector-Machine and the Multi-Layered-Perceptron) and the k-Nearest-Neighbors. These activities were carried out within the framework of the GRINFOMED- MEDIFIRE also developing a specific software named Spatial Forest Modeler (SFM) able to analyze existing relationships between remotely sensed variables and data collected in the field in order to identify the best available models to map and estimate the studied variables acquired on the basis of a field sampling design. The present paper presents data collected in the field, analysis and modeling methods and achieved results. The SFM software is also presented.