Loading...
Pubblicazioni Scientifiche
Filtri di ricerca 12 risultati
Pubblicazioni per anno
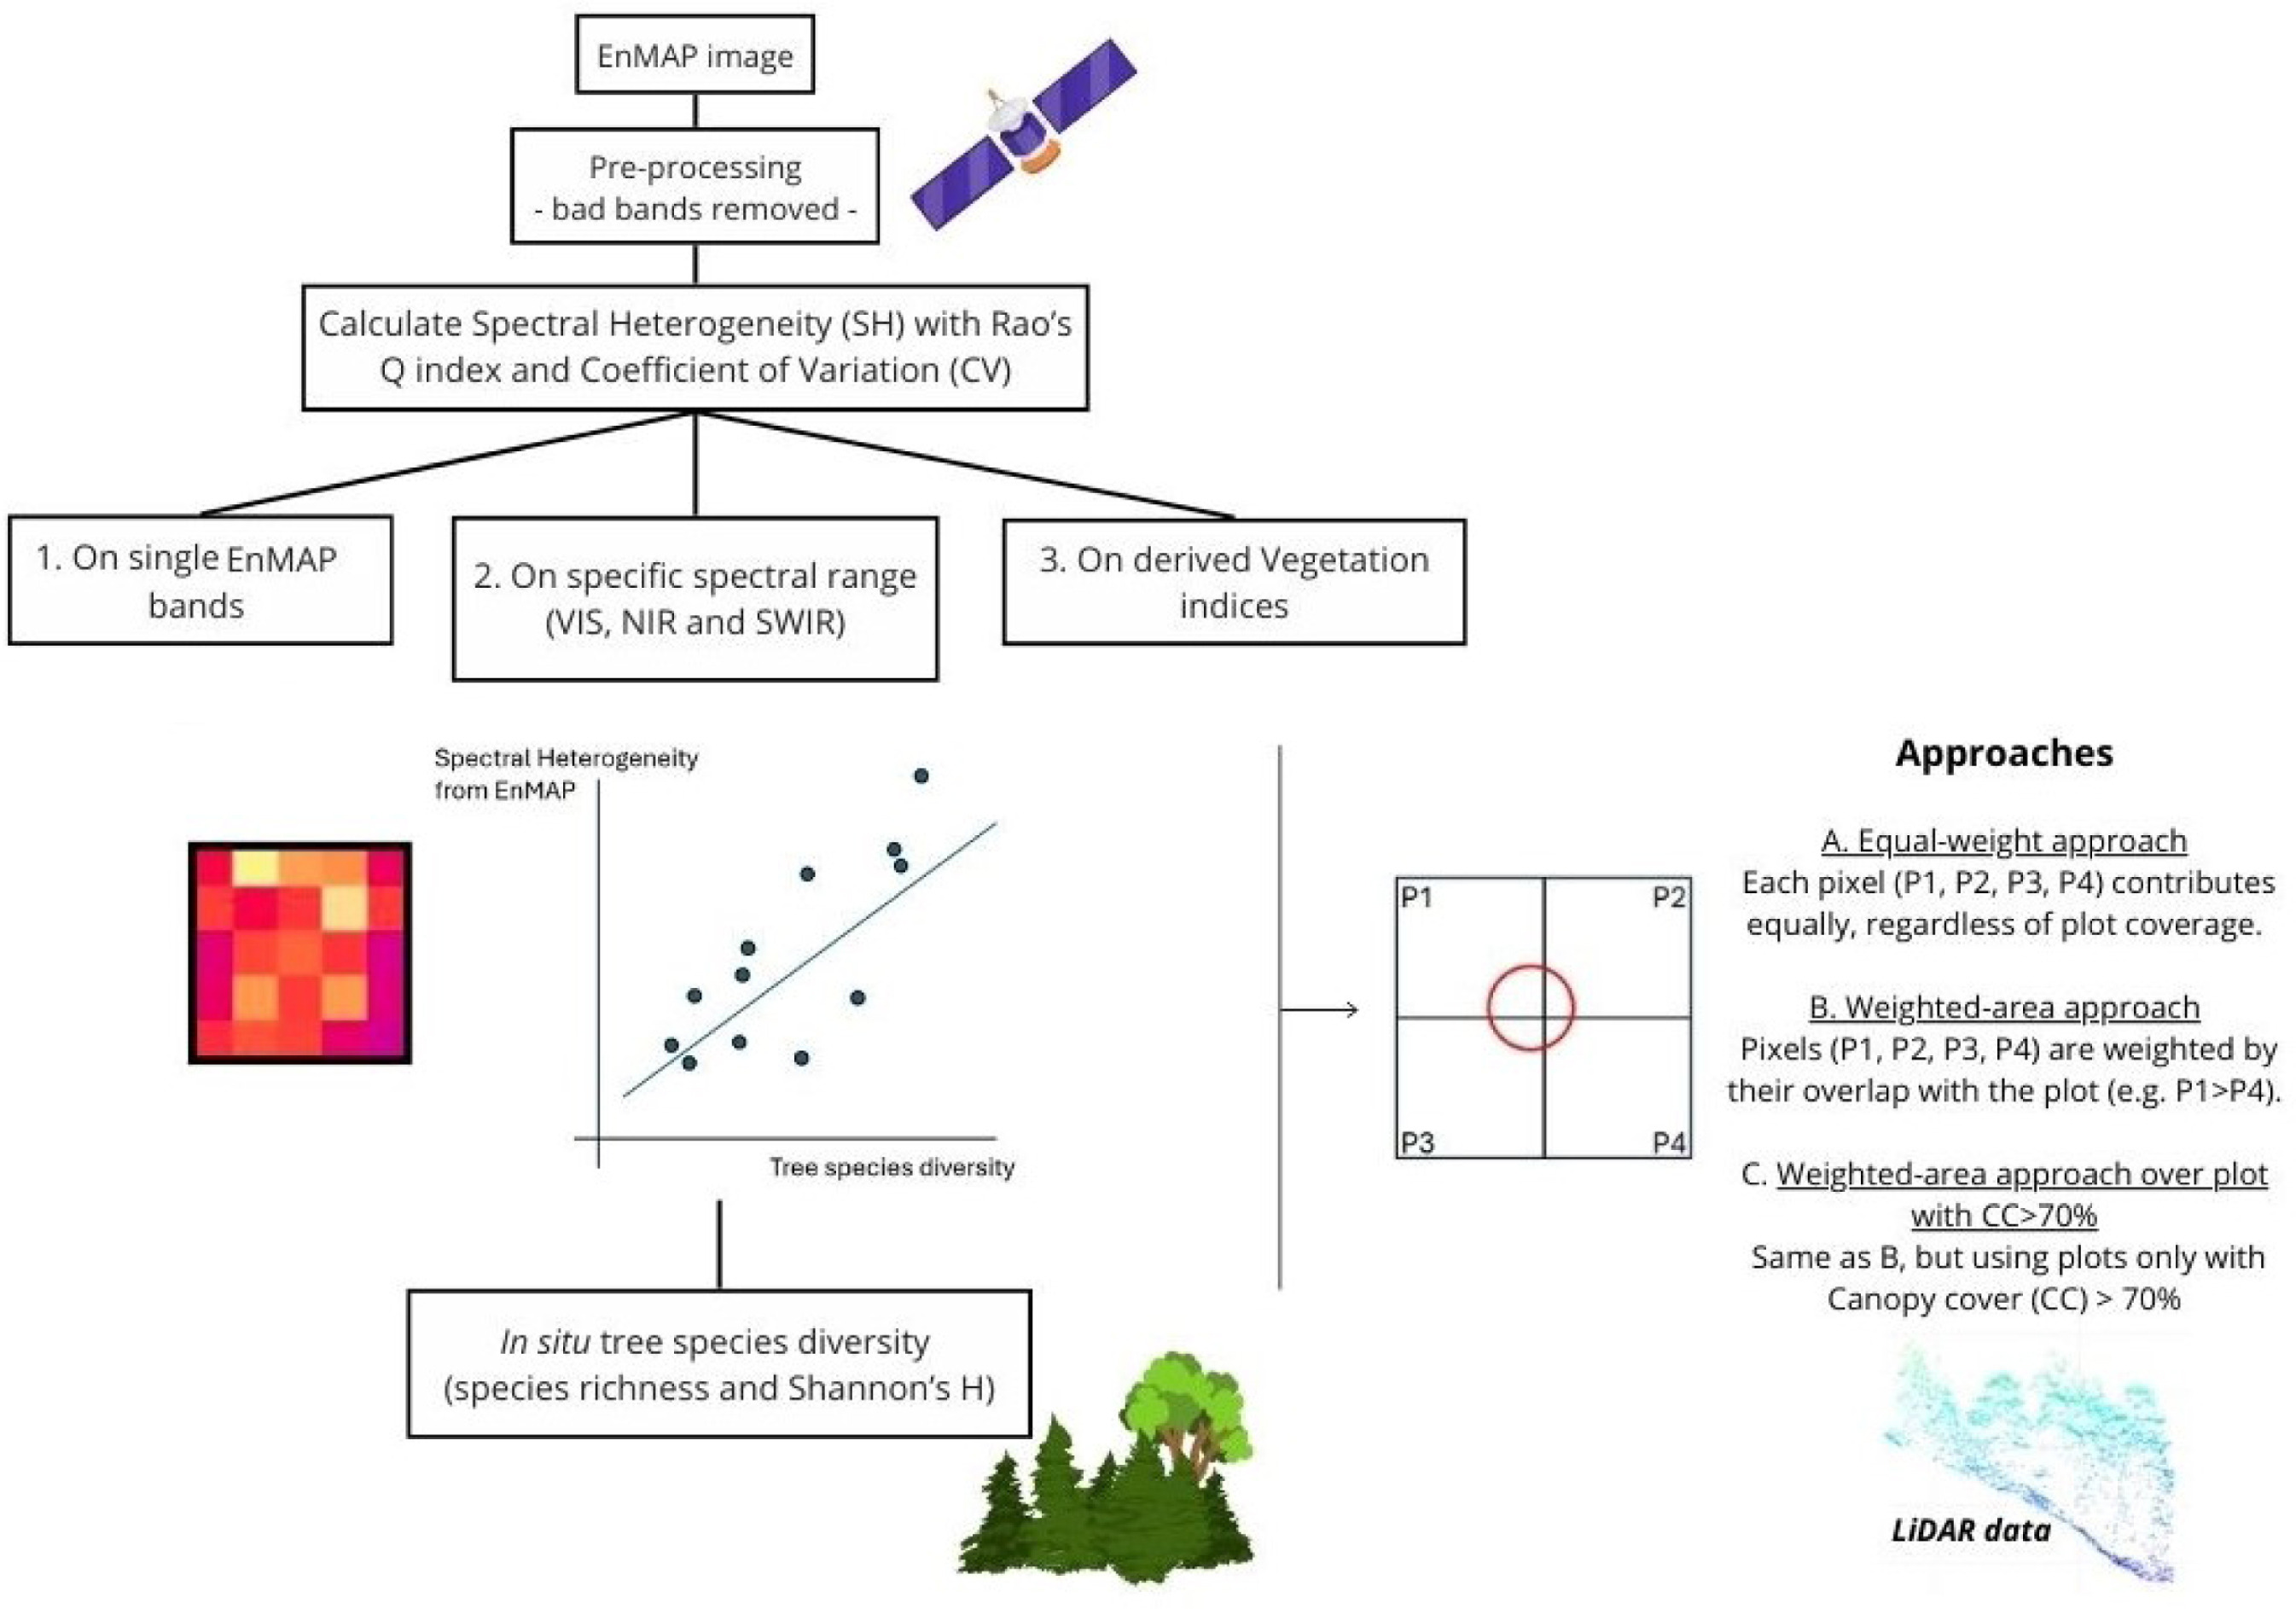
Spectral heterogeneity from the spaceborne imaging spectrometer EnMAP reveals biodiversity patterns in forest ecosystems
Torresani
,
Michele
,
Rossi
,
Christian
,
Mina
,
Marco
,
Menegaldo
,
Irene
,
Cappuccio
,
Matteo
,
Perrone
,
Michela
,
Hakkenberg
,
Christopher R.
,
Rocchini
,
Duccio
,
Puletti
,
Nicola
,
Stendardi
,
Laura
,
Montagnani
,
Leonardo
,
Tognetti
,
Roberto
Mostra abstract
The Spectral Variation Hypothesis (SVH) proposes that spectral heterogeneity (SH), derived from optical data, can serve as a proxy for estimating biodiversity. In this study, we tested the SVH across 42 forest plots in the Italian Alps using imaging spectroscopy data from the EnMAP satellite. We investigated the relationship between SH—quantified using two different metrics, Rao's Q and the coefficient of variation (CV)—and tree species diversity (using Shannon's H index and species richness). We applied three levels of spectral analysis: (1) SH calculated for each individual EnMAP band; (2) SH aggregated across broader spectral ranges (Visible -VIS-, Near Infrared -NIR-, and Shortwave Infrared -SWIR-) and (3) SH derived from vegetation indices (VIs). These analyses were performed under three spatial approaches: (A) a normal approach assigning equal weight to all four EnMAP pixels intersecting a plot; (B) a weighted approach based on the proportional overlap of each pixel with the plot area; and (C) a weighted canopy cover (CC)>70% approach, which included only plots with CC greater than 70% as derived from airborne laser scanning (ALS) LiDAR data. Weak to moderate correlations were observed when SH was derived from single bands, with the strongest relationships in the NIR (R<sup>2</sup> approaching 0.4), followed by the VIS and SWIR regions. A similar trend emerged when SH was aggregated across broader spectral ranges, with the highest correlations again found in the NIR (R<sup>2</sup> up to 0.35). In contrast, lower R<sup>2</sup> values were obtained when SH was computed from specific VIs. The weighted approaches, especially when restricted to plots with CC >70%, consistently yielded higher R<sup>2</sup> values than the equal-weight approach in all three the spectral analysis. Results were consistent across both SH metrics (Rao's Q and CV), with stronger correlations when species richness was used as the biodiversity metric. This work highlights how EnMAP hyperspectral data, despite inherent constraints, can provide valuable insights into forest biodiversity monitoring. © 2025 The Author(s)

Improving Aboveground Biomass Estimation in Beech Forests with 3D Tree Crown Parameters Derived from UAV-LS
Mostra abstract
Accurate estimates of aboveground biomass (AGB) are essential for forest policies to reduce carbon emissions. Unmanned aerial laser scanning (UAV-LS) offers unprecedented millimetric detail but is underutilized in monitoring broadleaf Mediterranean forests compared to coniferous ones. This study aims to design and evaluate a procedure for AGB estimates based on the predictive power of crown features. In the first step, we manually created Quantitative Structure Models (QSMs) for 320 trees using data from UAV laser scanning (UAV-LS), airborne laser scanning (ALS), and co-registered terrestrial laser scanning (TLS). This provided the most accurate non-destructive estimate of aboveground biomass (AGB) in the absence of destructive measurements. For each reference tree we also measured crown projection and crown volume to build two separated models relating AGB to such crown features. In the second phase, we evaluated the potential of UAV-LS for quantifying AGB in a pure European beech (Fagus sylvatica) forest and compared it with traditional ALS estimates, using fully automatic procedures. The two obtained tree-level AGB models were then tested using three datasets derived from 35 sampling plots over the same study area: (a) 1130 trees manually segmented (phase-2 reference); (b) trees automatically extracted from ALS data; and (c) trees automatically extracted from UAV-LS data. Results demonstrate that detailed UAV-LS data improve model sensitivity compared to ALS data (RMSE = 45.6 Mg ha<sup>−1</sup>, RMSE% = 13.4%, R2 = 0.65, for the best ALS model; RMSE = 44.0 Mg ha<sup>−1</sup>, RMSE% = 12.9%, R2 = 0.67, for the best UAV-LS model), allowing for the detection of AGB differences even in quite homogenous forest structures. Overall, this study demonstrates the combined use of both laser scanner data can foster non-destructive and more precise AGB estimation than the use of only one, in forested areas across hectare scales (1 to 100 ha). © 2025 by the authors.
Benchmarking tree species classification from proximally sensed laser scanning data: Introducing the FOR-species20K dataset
Puliti
,
Stefano
,
Lines
,
Emily R.
,
Müllerová
,
Jana
,
Frey
,
Julian
,
Schindler
,
Zoe
,
Straker
,
Adrian
,
Allen
,
Matthew J.
,
Winiwarter
,
Lukas
,
Rehush
,
Nataliia
,
Hristova
,
Hristina S.
,
Murray
,
Brent A.
,
Calders
,
Kim
,
Coops
,
Nicholas C.
,
Höfle
,
Bernhard
,
Irwin
,
Liam A.K.
,
Junttila
,
Samuli
,
Kruček
,
Martin
,
Krok
,
G.
,
Král
,
Kamil
,
Levick
,
Shaun R.
,
Lück
,
Linda
,
Missarov
,
Azim
,
Mokroš
,
M.
,
Owen
,
Harry Jon Foord
,
Stereńczak
,
Krzysztof Jan
,
Pitkänen
,
Timo P.
,
Puletti
,
Nicola
,
Saarinen
,
Ninni
,
Hopkinson
,
Chris Dennis
,
Terryn
,
Louise
,
Torresan
,
C.
,
Tomelleri
,
Enrico
,
Weiser
,
Hannah
,
Astrup
,
Rasmus
Mostra abstract
Proximally sensed laser scanning presents new opportunities for automated forest ecosystem data capture. However, a gap remains in deriving ecologically pertinent information, such as tree species, without additional ground data. Artificial intelligence approaches, particularly deep learning (DL), have shown promise towards automation. Progress has been limited by the lack of large, diverse, and, most importantly, openly available labelled single-tree point cloud datasets. This has hindered both (1) the robustness of the DL models across varying data types (platforms and sensors) and (2) the ability to effectively track progress, thereby slowing the convergence towards best practice for species classification. To address the above limitations, we compiled the FOR-species20K benchmark dataset, consisting of individual tree point clouds captured using proximally sensed laser scanning data from terrestrial (TLS), mobile (MLS) and drone laser scanning (ULS). Compiled collaboratively, the dataset includes data collected in forests mainly across Europe, covering Mediterranean, temperate and boreal biogeographic regions. It includes scattered tree data from other continents, totaling over 20,000 trees of 33 species and covering a wide range of tree sizes and forms. Alongside the release of FOR-species20K, we benchmarked seven leading DL models for individual tree species classification, including both point cloud (PointNet++, MinkNet, MLP-Mixer, DGCNNs) and multi-view 2D-based methods (SimpleView, DetailView, YOLOv5). 2D Image-based models had, on average, higher overall accuracy (0.77) than 3D point cloud-based models (0.72). Notably, the performance was consistently >0.8 across scanning platforms and sensors, offering versatility in deployment. The top-scoring model, DetailView, demonstrated robustness to training data imbalances and effectively generalized across tree sizes. The FOR-species20K dataset represents an important asset for developing and benchmarking DL models for individual tree species classification using proximally sensed laser scanning data. As such, it serves as a crucial foundation for future efforts to classify accurately and map tree species at various scales using laser scanning technology, as it provides the complete code base, dataset, and an initial baseline representative of the current state-of-the-art of point cloud tree species classification methods. © 2025 The Author(s). Methods in Ecology and Evolution published by John Wiley & Sons Ltd on behalf of British Ecological Society.
Mapping Understory Vegetation Density in Mediterranean Forests: Insights from Airborne and Terrestrial Laser Scanning Integration
forest biodiversity
lidar
terrestrial laser scanner
forest structure
spatial prediction
voxelization
Mostra abstract
The understory is an essential ecological and structural component of forest ecosystems. The lack of efficient, accurate, and objective methods for evaluating and quantifying the spatial spread of understory characteristics over large areas is a challenge for forest planning and management, with specific regard to biodiversity and habitat governance. In this study, we used terrestrial and airborne laser scanning (TLS and ALS) data to characterize understory in a European beech and black pine forest in Italy. First, we linked understory structural features derived from traditional field measurements with TLS metrics, then, we related such metrics to the ones derived from ALS. Results indicate that (i) the upper understory density (5–10 m above ground) is significantly associated with two ALS metrics, specifically the mean height of points belonging to the lower third of the ALS point cloud within the voxel (HM<inf>1/3</inf>) and the corresponding standard deviation (SD<inf>1/3</inf>), while (ii) for the lower understory layer (2–5 m above ground), the most related metric is HM<inf>1/3</inf> alone. As an example application, we have produced a map of forest understory for each layer, extending over the entire study region covered by ALS data, based on the developed spatial prediction models. With this study, we also demonstrated the power of hand-held mobile-TLS as a fast and high-resolution tool for measuring forest structural attributes and obtaining relevant ecological data. © 2023 by the authors.
Estimated biomass loss caused by the vaia windthrow in northern italy: Evaluation of active and passive remote sensing options
Vaglio Laurin
,
Gaia
,
Puletti
,
Nicola
,
Tattoni
,
Clara
,
Ferrara
,
Carlotta
,
Pirotti
,
Francesco
Mostra abstract
Windstorms are a major disturbance factor for European forests. The 2018 Vaia storm, felled large volumes of timber in Italy causing serious ecological and financial losses. Remote sensing is fundamental for primary assessment of damages and post‐emergency phase. An explicit estimation of the timber loss caused by Vaia using satellite remote sensing was not yet undertaken. In this investigation, three different estimates of timber loss were compared in two study sites in the Alpine area: pre‐existing local growing stock volume maps based on lidar data, a recent national‐level forest volume map, and an novel estimation of AGB values based on active and passive remote sensing. The compared datasets resemble the type of information that a forest manager might potentially find or produce. The results show a significant disagreement in the different biomass estimates, related to the methods used to produce them, the study areas characteristics, and the size of the damaged areas. These sources of uncertainty highlight the difficulty of estimating timber loss, unless a unified national or regional European strategy to improve preparedness to forest hazards is defined. Considering the frequent impacts on forest resources that occurred in the last years in the European Union, remote sensing‐based surveys targeting forests is urgent, particularly for the many European countries that still lack reliable forest stocks data. © 2021 by the authors. Licensee MDPI, Basel, Switzerland.
Characterizing subcanopy structure of Mediterranean forests by terrestrial laser scanning data
forest biodiversity
lidar
terrestrial laser scanner
forest structure
spatial prediction
voxelization
Mostra abstract
Vegetation structure is one of the key factors in forest ecosystems. Especially understory structure has major implications for wildlife habitat selection, reproduction, and survival. Structural indices traditionally used to characterize understory vegetation are based on field vegetation surveys describing general features such as leaf area index (LAI), canopy cover or vegetation height, hiding much of the three-dimensional vegetation structure complexity. The application of terrestrial laser scanning (TLS) in forest ecological and management applications is becoming more effective. In this study, we use TLS data to quantify spatial attributes of forest subcanopy in four different forest strata ranging from 0.5 m to 10 m from the ground. We collected data in 12 plots of mature European beech (Fagus sylvatica L.) forests and 12 plots of mature black pine (Pinus nigra subsp. laricio Maire) forests, located in the Sila National Park, Italy. We propose a TLS-based approach to estimate a fine-scale vegetation density using the Plant Density Index (PDI) and to test the PDI at different height classes. We found a significant relationship between the PDI and the number of trees belonging to the dominant layer, using the Spearman correlation coefficient (r = 0.83, p<inf>val</inf> = 0.001). Basing on PDI values, a cluster analysis of the four subcanopy strata was carried out for deriving clusters of structurally homogeneous forest plots. Results identified three clusters in terms of the vegetation features in the horizontal height classes: the first cluster primarily includes Beech forests characterized by plots with the highest tree densities; the second one includes both Beech and Pine forests characterized by dense ground vegetation and shrubs and an intermediate tree density; the third group is represented by Pine forests with massive presence of vegetation lower strata and moderate tree density. Then, PCA allowed identifying the relationship between the considered subcanopy layers and forest plots. © 2021 Elsevier B.V.
Species dominance and above ground biomass in the Białowieża Forest, Poland, described by airborne hyperspectral and lidar data
Vaglio Laurin
,
Gaia
,
Puletti
,
Nicola
,
Grotti
,
Mirko
,
Stereńczak
,
Krzysztof Jan
,
Modzelewska
,
Aneta
,
Lisiewicz
,
Maciej
,
Sadkowski
,
Rafał
,
Kuberski
,
Łukasz
,
Chirici
,
Gherardo
,
Papale
,
Dario
climate change
lidar
aboveground biomass
algorithm
data set
deciduous tree
species diversity
species richness
vegetation dynamics
bialowieza forest
scolytinae
Mostra abstract
The objective of this research is to test and evaluate hyperspectral and lidar data to derive information on tree species dominance and above ground biomass in the Białowieża Forest in Poland. This forest is threatened by climate change, fire, bark beetles attacks, and logging, with changes in species composition and dominance. In this conservation valuable area, the monitoring of forest resources is thus critical. Results indicate that vegetation indices from hyperspectral data can support species dominance detection: using a Classification and Regression Trees algorithm the three main plot types (dominated by Deciduous, Spruce, and Pines species) were classified with an Overall Accuracy > 0.9. The accuracy decreased when a ‘Mixed’ group was added to account for very heterogeneous plots, and plots dominated by Spruce were not correctly detected. Hyperspectral vegetation indices were also used to estimate the level of species dominance in the forest plots, using a Multivariate Multiple Linear Regression model; the obtained accuracy varied according to groups, being higher for Deciduous (R<sup>2</sup> = 0.87), compared to Pines (R<sup>2</sup> = 0.61), and to Spruce-dominated plots (R<sup>2</sup> = 0.37). Lidar data were employed to estimate above ground biomass, using an exponential regression model; overall the R<sup>2</sup> resulted equal to 0.66 but ranged from 0.57 to 0.78 when considering subgroups according to species dominance; the addition of hyperspectral vegetation indices improved the result only for Pines. The illustrated methods provide a reliable description of important forest characteristics and simplify resource monitoring, supporting local authorities to address the challenges imposed by climate change and other forest threats. © 2020 The Authors
Global airborne laser scanning data providers database (GlobALS)-A new tool for monitoring ecosystems and biodiversity
Stereńczak
,
Krzysztof Jan
,
Vaglio Laurin
,
Gaia
,
Chirici
,
Gherardo
,
Coomes
,
David Anthony
,
Dalponte
,
Michele
,
Latifi
,
Hooman
,
Puletti
,
Nicola
Mostra abstract
Protection and recovery of natural resource and biodiversity requires accurate monitoring at multiple scales. Airborne Laser Scanning (ALS) provides high-resolution imagery that is valuable for monitoring structural changes to vegetation, providing a reliable reference for ecological analyses and comparison purposes, especially if used in conjunction with other remote-sensing and field products. However, the potential of ALS data has not been fully exploited, due to limits in data availability and validation. To bridge this gap, the global network for airborne laser scanner data (GlobALS) has been established as a worldwide network of ALS data providers that aims at linking those interested in research and applications related to natural resources and biodiversity monitoring. The network does not collect data itself but collects metadata and facilitates networking and collaborative research amongst the end-users and data providers. This letter describes this facility, with the aim of broadening participation in GlobALS. © 2020 by the authors.
Integrating terrestrial and airborne laser scanning for the assessment of single-tree attributes in Mediterranean forest stands
Giannetti
,
Francesca
,
Puletti
,
Nicola
,
Quatrini
,
Valerio
,
Travaglini
,
Davide
,
Bottalico
,
Francesca
,
Corona
,
P.
,
Chirici
,
Gherardo
Mostra abstract
The development of laser scanning technologies has gradually modified methods for forest mensuration and inventory. The main objective of this study is to assess the potential of integrating ALS and TLS data in a complex mixed Mediterranean forest for assessing a set of five single-tree attributes: tree position (TP), stem diameter at breast height (DBH), tree height (TH), crown base height (CBH) and crown projection area radii (CPAR). Four different point clouds were used: from ZEB1, a hand-held mobile laser scanner (HMLS), and from FARO® FOCUS 3D, a static terrestrial laser scanner (TLS), both alone or in combination with ALS. The precision of single-tree predictions, in terms of bias and root mean square error, was evaluated against data recorded manually in the field with traditional instruments. We found that: (i) TLS and HMLS have excellent comparable performances for the estimation of TP, DBH and CPAR; (ii) TH was correctly assessed by TLS, while the accuracy by HMLS was lower; (iii) CBH was the most difficult attribute to be reliably assessed and (iv) the integration with ALS increased the performance of the assessment of TH and CPAR with both HMLS and TLS. © 2018, © 2018 The Author(s). Published by Informa UK Limited, trading as Taylor & Francis Group.
Above ground biomass and tree species richness estimation with airborne lidar in tropical Ghana forests
Vaglio Laurin
,
Gaia
,
Puletti
,
Nicola
,
Chen
,
Qi
,
Corona
,
P.
,
Papale
,
Dario
,
Valentini
,
Riccardo
Mostra abstract
Estimates of forest aboveground biomass are fundamental for carbon monitoring and accounting; delivering information at very high spatial resolution is especially valuable for local management, conservation and selective logging purposes. In tropical areas, hosting large biomass and biodiversity resources which are often threatened by unsustainable anthropogenic pressures, frequent forest resources monitoring is needed. Lidar is a powerful tool to estimate aboveground biomass at fine resolution; however its application in tropical forests has been limited, with high variability in the accuracy of results. Lidar pulses scan the forest vertical profile, and can provide structure information which is also linked to biodiversity. In the last decade the remote sensing of biodiversity has received great attention, but few studies focused on the use of lidar for assessing tree species richness in tropical forests. This research aims at estimating aboveground biomass and tree species richness using discrete return airborne lidar in Ghana forests. We tested an advanced statistical technique, Multivariate Adaptive Regression Splines (MARS), which does not require assumptions on data distribution or on the relationships between variables, being suitable for studying ecological variables. We compared the MARS regression results with those obtained by multilinear regression and found that both algorithms were effective, but MARS provided higher accuracy either for biomass (R<sup>2</sup> = 0.72) and species richness (R<sup>2</sup> = 0.64). We also noted strong correlation between biodiversity and biomass field values. Even if the forest areas under analysis are limited in extent and represent peculiar ecosystems, the preliminary indications produced by our study suggest that instrument such as lidar, specifically useful for pinpointing forest structure, can also be exploited as a support for tree species richness assessment. © 2016 Elsevier B.V.
Development and performance assessment of a low-cost UAV laser scanner system (LasUAV)
Torresan
,
C.
,
Berton
,
Andrea
,
Carotenuto
,
Federico
,
Chiavetta
,
U.
,
Miglietta
,
F.
,
Zaldei
,
Alessandro
,
Gioli
,
Beniamino
lidar
forest monitoring
global navigation satellite system
real-time kinematics technology
system designing
system testing
Mostra abstract
This study reports on a low-cost unmanned aerial vehicle (UAV)-borne light detection and ranging (LiDAR) system called LasUAV, from hardware selection and integration to the generation of three-dimensional point clouds, and an assessment of its performance. Measurement uncertainties were estimated in angular static, angular dynamic, and real flight conditions. The results of these experiments indicate that the point cloud elevation accuracy in the case of angular static acquisition was 3.8 cm, and increased to 3.9 cm in angular dynamic acquisition. In-flight data were acquired over a target surveyed by nine single passages in different flight directions and platform orientations. In this case, the uncertainty of elevation ranged between 5.1 cm and 9.8 cm for each single passage. The combined elevation uncertainty in the case of multiple passages (i.e., the combination of one to nine passages from the set of nine passages) ranged between 5 cm (one passage) and 16 cm (nine passages). The study demonstrates that the positioning device, i.e., the Global Navigation Satellite System real-time kinematic (GNSS RTK) receiver, is the sensor that mostly influences the system performance, followed by the attitude measurement device and the laser sensor. Consequently, strong efforts and greater economic investment should be devoted to GNSS RTK receivers in low-cost custom integrated systems. © 2018 by the authors.
Applying quantitative structure models to plot-based terrestrial laser data to assess dendrometric parameters in dense mixed forests
lidar
forest inventory
computree
geometrical modeling metrics
simpletree
tree segmentation
wood volume
Mostra abstract
Aim of study: To assess terrestrial laser scanning (TLS) accuracy in estimating biometrical forest parameters at plot-based level in order to replace manual survey for forest inventory purposes. Area of study: Monte Morello, Tuscany region, Italy. Materials and methods: In 14 plots (10 m radius) in dense Mediterranean mixed conifer forests, diameter at breast height (DBH) and height were measured in Summer 2016. Tree volume was computed using the second Italian National Forest Inventory (INFC II) equations. TLS data were acquired in the same plots and quantitative structure models (QSMs) were applied to TLS data to compute dendrometric parameters. Tree parameters measured in field survey, i.e. DBH, height, and computed volume, were compared to those resulting from TLS data processing. The effect of distance from the plot boundary in the accuracy of DBH, height and volume estimation from TLS data was tested. Main results: TLS-derived DBH showed a good correlation with the traditional forest inventory data (R<sup>2</sup>=0.98, RRMSE=7.81%), while tree height was less correlated with the traditional forest inventory data (R<sup>2</sup>=0.60, RRMSE=16.99%). Poor agreement was observed when comparing the volume from TLS data with volume estimated from the INFC II prediction equations. Research highlights: The study demonstrated that the application of QSM to plot-based terrestrial laser data generates errors in plots with high density of coniferous trees. A buffer zone of 5 m would help reduce the error of 35% and 42% respectively in height estimation for all trees and in volume estimation for broadleaved trees. © 2018 INIA.