Loading...
Pubblicazioni Scientifiche
Filtri di ricerca 8 risultati
Pubblicazioni per anno
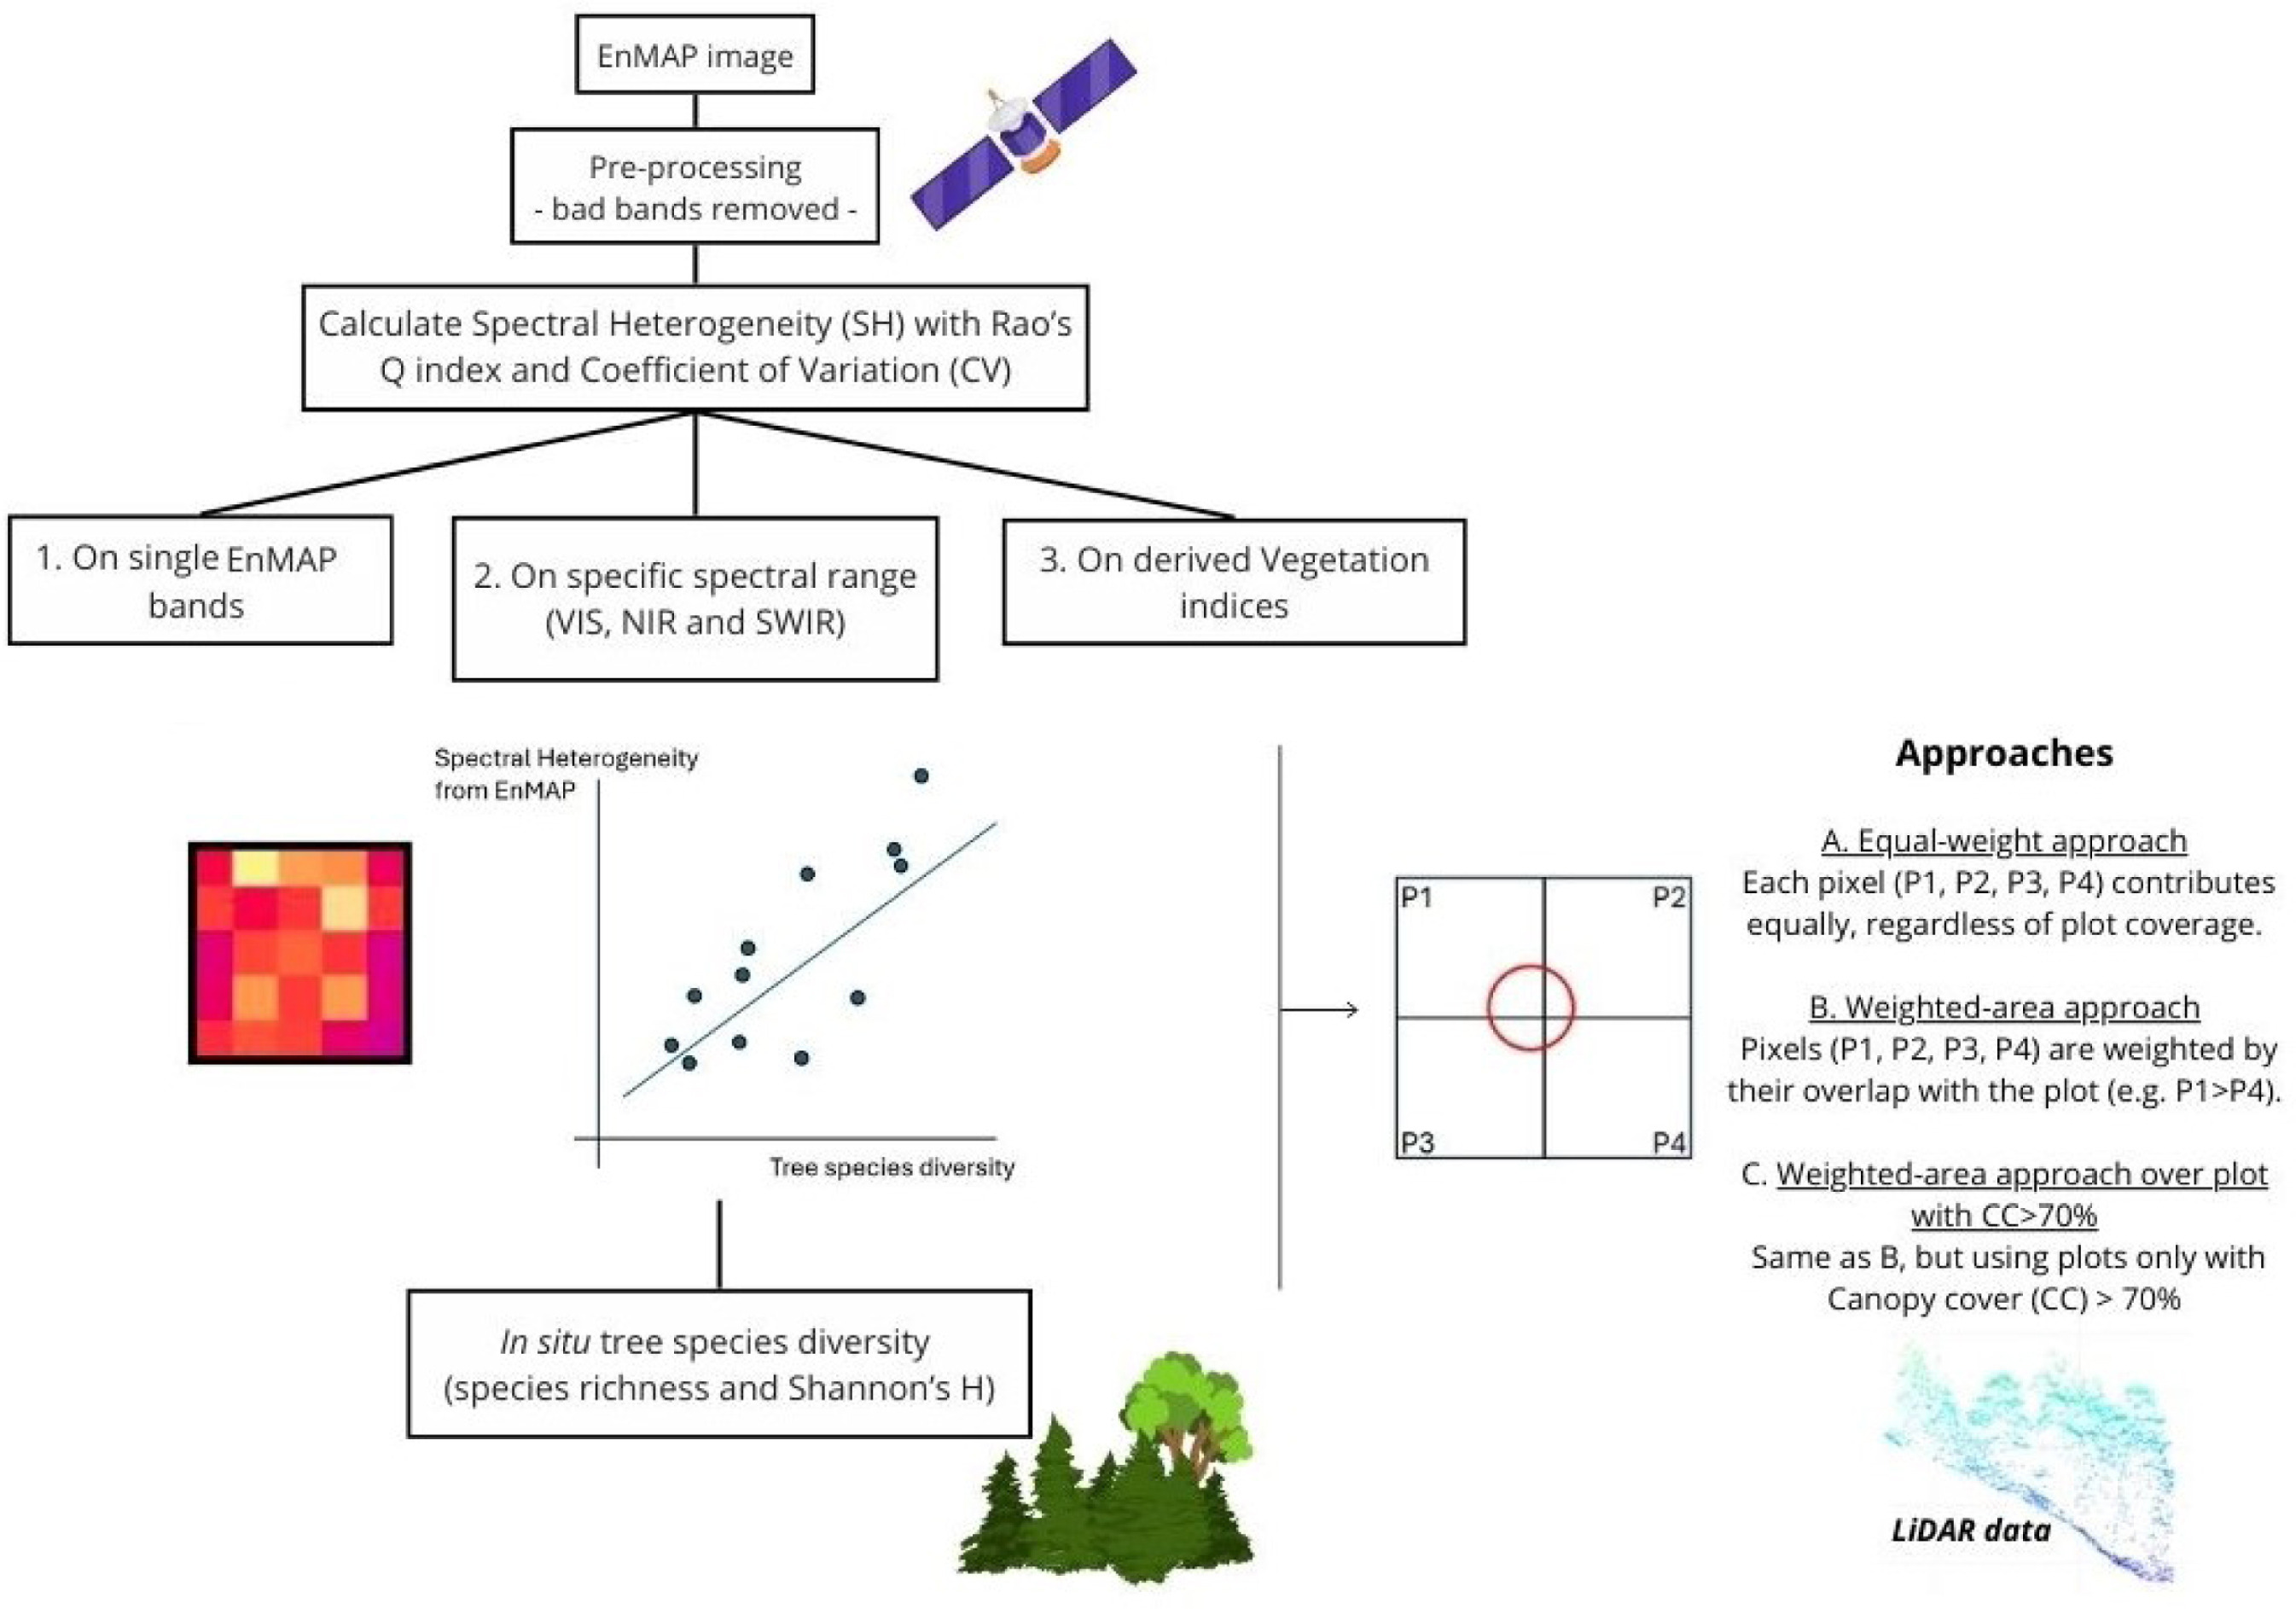
Spectral heterogeneity from the spaceborne imaging spectrometer EnMAP reveals biodiversity patterns in forest ecosystems
Torresani
,
Michele
,
Rossi
,
Christian
,
Mina
,
Marco
,
Menegaldo
,
Irene
,
Cappuccio
,
Matteo
,
Perrone
,
Michela
,
Hakkenberg
,
Christopher R.
,
Rocchini
,
Duccio
,
Puletti
,
Nicola
,
Stendardi
,
Laura
,
Montagnani
,
Leonardo
,
Tognetti
,
Roberto
Mostra abstract
The Spectral Variation Hypothesis (SVH) proposes that spectral heterogeneity (SH), derived from optical data, can serve as a proxy for estimating biodiversity. In this study, we tested the SVH across 42 forest plots in the Italian Alps using imaging spectroscopy data from the EnMAP satellite. We investigated the relationship between SH—quantified using two different metrics, Rao's Q and the coefficient of variation (CV)—and tree species diversity (using Shannon's H index and species richness). We applied three levels of spectral analysis: (1) SH calculated for each individual EnMAP band; (2) SH aggregated across broader spectral ranges (Visible -VIS-, Near Infrared -NIR-, and Shortwave Infrared -SWIR-) and (3) SH derived from vegetation indices (VIs). These analyses were performed under three spatial approaches: (A) a normal approach assigning equal weight to all four EnMAP pixels intersecting a plot; (B) a weighted approach based on the proportional overlap of each pixel with the plot area; and (C) a weighted canopy cover (CC)>70% approach, which included only plots with CC greater than 70% as derived from airborne laser scanning (ALS) LiDAR data. Weak to moderate correlations were observed when SH was derived from single bands, with the strongest relationships in the NIR (R<sup>2</sup> approaching 0.4), followed by the VIS and SWIR regions. A similar trend emerged when SH was aggregated across broader spectral ranges, with the highest correlations again found in the NIR (R<sup>2</sup> up to 0.35). In contrast, lower R<sup>2</sup> values were obtained when SH was computed from specific VIs. The weighted approaches, especially when restricted to plots with CC >70%, consistently yielded higher R<sup>2</sup> values than the equal-weight approach in all three the spectral analysis. Results were consistent across both SH metrics (Rao's Q and CV), with stronger correlations when species richness was used as the biodiversity metric. This work highlights how EnMAP hyperspectral data, despite inherent constraints, can provide valuable insights into forest biodiversity monitoring. © 2025 The Author(s)

Benchmarking tree species classification from proximally sensed laser scanning data: Introducing the FOR-species20K dataset
Puliti
,
Stefano
,
Lines
,
Emily R.
,
Müllerová
,
Jana
,
Frey
,
Julian
,
Schindler
,
Zoe
,
Straker
,
Adrian
,
Allen
,
Matthew J.
,
Winiwarter
,
Lukas
,
Rehush
,
Nataliia
,
Hristova
,
Hristina S.
,
Murray
,
Brent A.
,
Calders
,
Kim
,
Coops
,
Nicholas C.
,
Höfle
,
Bernhard
,
Irwin
,
Liam A.K.
,
Junttila
,
Samuli
,
Kruček
,
Martin
,
Krok
,
G.
,
Král
,
Kamil
,
Levick
,
Shaun R.
,
Lück
,
Linda
,
Missarov
,
Azim
,
Mokroš
,
M.
,
Owen
,
Harry Jon Foord
,
Stereńczak
,
Krzysztof Jan
,
Pitkänen
,
Timo P.
,
Puletti
,
Nicola
,
Saarinen
,
Ninni
,
Hopkinson
,
Chris Dennis
,
Terryn
,
Louise
,
Torresan
,
C.
,
Tomelleri
,
Enrico
,
Weiser
,
Hannah
,
Astrup
,
Rasmus
Mostra abstract
Proximally sensed laser scanning presents new opportunities for automated forest ecosystem data capture. However, a gap remains in deriving ecologically pertinent information, such as tree species, without additional ground data. Artificial intelligence approaches, particularly deep learning (DL), have shown promise towards automation. Progress has been limited by the lack of large, diverse, and, most importantly, openly available labelled single-tree point cloud datasets. This has hindered both (1) the robustness of the DL models across varying data types (platforms and sensors) and (2) the ability to effectively track progress, thereby slowing the convergence towards best practice for species classification. To address the above limitations, we compiled the FOR-species20K benchmark dataset, consisting of individual tree point clouds captured using proximally sensed laser scanning data from terrestrial (TLS), mobile (MLS) and drone laser scanning (ULS). Compiled collaboratively, the dataset includes data collected in forests mainly across Europe, covering Mediterranean, temperate and boreal biogeographic regions. It includes scattered tree data from other continents, totaling over 20,000 trees of 33 species and covering a wide range of tree sizes and forms. Alongside the release of FOR-species20K, we benchmarked seven leading DL models for individual tree species classification, including both point cloud (PointNet++, MinkNet, MLP-Mixer, DGCNNs) and multi-view 2D-based methods (SimpleView, DetailView, YOLOv5). 2D Image-based models had, on average, higher overall accuracy (0.77) than 3D point cloud-based models (0.72). Notably, the performance was consistently >0.8 across scanning platforms and sensors, offering versatility in deployment. The top-scoring model, DetailView, demonstrated robustness to training data imbalances and effectively generalized across tree sizes. The FOR-species20K dataset represents an important asset for developing and benchmarking DL models for individual tree species classification using proximally sensed laser scanning data. As such, it serves as a crucial foundation for future efforts to classify accurately and map tree species at various scales using laser scanning technology, as it provides the complete code base, dataset, and an initial baseline representative of the current state-of-the-art of point cloud tree species classification methods. © 2025 The Author(s). Methods in Ecology and Evolution published by John Wiley & Sons Ltd on behalf of British Ecological Society.
Performance assessment of two plotless sampling methods for density estimation applied to some Alpine forests of northeastern Italy
accuracy
conditional inference trees
distance-based density estimator
forest monitoring
ordered distance method
point-centred quarter method
precision
Mostra abstract
In this study, we tested two plotless sampling methods, the ordered distance method and point-centred quarter method, to estimate the tree density and basal area in some managed Alpine forests in northeastern Italy. We selected nine independent forest stands, classified according to the spatial distribution patterns of trees (cluster, random, regular). A plotless sampling survey was simulated within the selected stands and the tree density and basal area were estimated by applying both the ordered distance method and point-centred quarter method. We compared the estimates, in terms of accuracy and preci-sion, between the two methods and against estimates obtained from a simulated survey based on a plot-based sampling method. The point-centred quarter method outperformed the ordered distance method in terms of both accuracy and precision, showing higher robustness towards the bias related to non-random spatial patterns. However, both the plotless methods we tested can provide unbiased accuracy of estimates which, in addition, do not differ from estimates of plot-based sampling. The satisfactory results are encouraging for further tests over other Italian Alpine as well as Apennine forests. If con-firmed, the plotless sampling method, especially the point-centred quarter method, could represent an effective alternative whenever plot-based sampling is deemed redundant, or expensive. © SISEF.
A PLOT SAMPLING STRATEGY FOR ESTIMATING THE AREA OF OLIVE TREE CROPS AND OLIVE TREE ABUNDANCE IN A MEDITERRANEAN ENVIRONMENT
Grotti
,
Mirko
,
Puletti
,
Nicola
,
Chianucci
,
Francesco
,
Mattioli
,
Walter
,
Floris
,
Antonio
,
Clementel
,
Fabrizio
,
Torresan
,
C.
,
Marchi
,
Maurizio
,
Gentile
,
Alessandra
,
Pisante
,
Michele
,
Marcelli
,
Agnese
,
Corona
,
P.
Mostra abstract
Accurate inventory and mapping of olive (Olea europaea L.) tree attributes represents a central issue to support the olive production system. With reference to the cultivation, there is a high heterogeneity and complexity in the cultivation of olive trees, which is reflected in the large variability in olive grove surfaces. This poses some challenge in accurately estimating olive tree attributes via traditional inventory approaches, as commonly adopted in national forest inventory. From a methodological point of view, the complexity and heterogeneity of olive tree groves can be comparable to the problem of accurately estimating tree outside forests (TOF) attributes. In this study, we tested whether a plot sampling approach formerly developed for TOF is suitable for estimating olive tree attributes at large scale. We tested this approach in a case study where the census of the olive crop area and the number of olive groves was conducted from photo-interpretation of high resolution aerial orthoimagery, used as benchmark to test the effectiveness of the plot sampling approach. The main result of this study is that the plot sampling method can be applied for estimating olive tree attributes. Our obtained RSEs were below 20%, with a limited sampling effort of about 6% of the studied population; the obtained RSEs were below 6% when increasing sampling up to about 21% the studied population. Using robust statistical procedures among countries, should allow obtaining harmonized and comparable information, which can increase the knowledge of olive geographical distribution and structure at its relevant Mediterranean scale. © 2019, Italian Society of Remote Sensing. All rights reserved.
Comparison of TLS against traditional surveying method for stem taper modelling. A case study in European beech (Fagus sylvatica L.) forests of mount Amiata
Torresan
,
C.
,
Pelleri
,
F.
,
Manetti
,
Maria Chiara
,
Becagli
,
Claudia
,
Castaldi
,
Cristiano
,
Notarangelo
,
Monica
,
Chiavetta
,
U.
Mostra abstract
Traditionally, taper equations are developed from measurements collected through a destructive sampling of trees. Terrestrial laser scanning (TLS) enables high levels of accuracy of individual tree parameters measurement avoiding tree felling. With this study, we wanted to assess the performance of two approaches to calibrate a taper function: using stem diameters extracted from TLS point clouds and measured at different tree heights with the traditional and usual forest instruments. We compared the performance of four taper equations built with data collected by TLS and traditional survey in a European beech (Fagus sylvatica L.) forests of mount Amiata (Tuscany Region, Italy). We computed the volume of stem sections 1.00 m long by integrating the most performing TLS-based taper equation and by the Huber, Smalian and cone formulas applied on the diameter and height values measured with the traditional field surveys. We conducted the analysis of error distribution in volume estimates computed integrating the most performing TLS-based taper function along the stem. We tested if the differences in the volume estimate of the two methods were significant. Schumacher and Hall (1933) equation was the most performing taper function both in case of using TLS and traditional surveyed data, being the TLS-based function more performant (rRMSE = 6.90% vs 9.17%). Its performance did not increase when diameter values were extracted from TLS point clouds with a higher frequency (i.e. 25.0 cm vs 1.00 m). By integrating the TLS-based Schumacher and Hall (1933) function, the sections with the highest error resulted from 5.00 to 7.00 m of stem height (i.e. RMSE from 14.72 to 19.14 dm<sup>3</sup> and rRMSE from 13.00 to 17.76%). This study case represents the first attempts to develop a taper equation for European beech of mount Amiata using values of stem diameter and height extracted from the TLS point cloud. The results demonstrated that TLS produces the same stem volume estimates as traditional method avoiding falling trees. © 2021 Centro di Ricerca per la Selvicoltura, Consiglio per la Ricerca in Agricoltura e l'Analisi dell'Economia Agraria. All rights reserved.
Individual tree crown segmentation in two-layered dense mixed forests from uav lidar data
Torresan
,
C.
,
Carotenuto
,
Federico
,
Chiavetta
,
U.
,
Miglietta
,
F.
,
Zaldei
,
Alessandro
,
Gioli
,
Beniamino
forest inventory
detection rate
itc detection algorithms
itcsegment package
laser scanning
lidr package
parameter calibration
Mostra abstract
In forests with dense mixed canopies, laser scanning is often the only effective technique to acquire forest inventory attributes, rather than structure-from-motion optical methods. This study investigates the potential of laser scanner data collected with a low-cost unmanned aerial vehicle laser scanner (UAV-LS), for individual tree crown (ITC) delineation to derive forest biometric parameters, over two-layered dense mixed forest stands in central Italy. A raster-based local maxima region growing algorithm (itcLiDAR) and a point cloud-based algorithm (li2012) were applied to isolate individual tree crowns, compute height and crown area, estimate the diameter at breast height (DBH) and the above ground biomass (AGB) of individual trees. To maximize the level of detection rate, the ITC algorithm parameters were tuned varying 1350 setting combinations and matching the segmented trees with field measured trees. For each setting, the delineation accuracy was assessed by computing the detection rate, the omission and commission errors over three forest plots. Segmentation using itcLiDAR showed detection rates between 40% and 57%, while ITC delineation was successful at segmenting trees with DBH larger than 10 cm (detection rate ~78%), while failed to detect trees with smaller DBH (detection rate ~37%). The performance of li2012 was quite lower with the higher detection rate equal to 27%. Errors and goodness-of-fit between field-surveyed and flight-derived biometric parameters (AGB and tree height) were species-dependent, with higher error and lower r<sup>2</sup> for shorter species that constitute the lowermost layer of the forest. Overall, while the application of UAV-LS to delineate tree crowns and estimate biometric parameters is satisfactory, its accuracy is affected by the presence of a multilayered and multispecies canopy that will require specific approaches and algorithms to better deal with the added complexity. © 2020 by the authors. Licensee MDPI, Basel, Switzerland.
Development and performance assessment of a low-cost UAV laser scanner system (LasUAV)
Torresan
,
C.
,
Berton
,
Andrea
,
Carotenuto
,
Federico
,
Chiavetta
,
U.
,
Miglietta
,
F.
,
Zaldei
,
Alessandro
,
Gioli
,
Beniamino
lidar
forest monitoring
global navigation satellite system
real-time kinematics technology
system designing
system testing
Mostra abstract
This study reports on a low-cost unmanned aerial vehicle (UAV)-borne light detection and ranging (LiDAR) system called LasUAV, from hardware selection and integration to the generation of three-dimensional point clouds, and an assessment of its performance. Measurement uncertainties were estimated in angular static, angular dynamic, and real flight conditions. The results of these experiments indicate that the point cloud elevation accuracy in the case of angular static acquisition was 3.8 cm, and increased to 3.9 cm in angular dynamic acquisition. In-flight data were acquired over a target surveyed by nine single passages in different flight directions and platform orientations. In this case, the uncertainty of elevation ranged between 5.1 cm and 9.8 cm for each single passage. The combined elevation uncertainty in the case of multiple passages (i.e., the combination of one to nine passages from the set of nine passages) ranged between 5 cm (one passage) and 16 cm (nine passages). The study demonstrates that the positioning device, i.e., the Global Navigation Satellite System real-time kinematic (GNSS RTK) receiver, is the sensor that mostly influences the system performance, followed by the attitude measurement device and the laser sensor. Consequently, strong efforts and greater economic investment should be devoted to GNSS RTK receivers in low-cost custom integrated systems. © 2018 by the authors.
Applying quantitative structure models to plot-based terrestrial laser data to assess dendrometric parameters in dense mixed forests
lidar
forest inventory
computree
geometrical modeling metrics
simpletree
tree segmentation
wood volume
Mostra abstract
Aim of study: To assess terrestrial laser scanning (TLS) accuracy in estimating biometrical forest parameters at plot-based level in order to replace manual survey for forest inventory purposes. Area of study: Monte Morello, Tuscany region, Italy. Materials and methods: In 14 plots (10 m radius) in dense Mediterranean mixed conifer forests, diameter at breast height (DBH) and height were measured in Summer 2016. Tree volume was computed using the second Italian National Forest Inventory (INFC II) equations. TLS data were acquired in the same plots and quantitative structure models (QSMs) were applied to TLS data to compute dendrometric parameters. Tree parameters measured in field survey, i.e. DBH, height, and computed volume, were compared to those resulting from TLS data processing. The effect of distance from the plot boundary in the accuracy of DBH, height and volume estimation from TLS data was tested. Main results: TLS-derived DBH showed a good correlation with the traditional forest inventory data (R<sup>2</sup>=0.98, RRMSE=7.81%), while tree height was less correlated with the traditional forest inventory data (R<sup>2</sup>=0.60, RRMSE=16.99%). Poor agreement was observed when comparing the volume from TLS data with volume estimated from the INFC II prediction equations. Research highlights: The study demonstrated that the application of QSM to plot-based terrestrial laser data generates errors in plots with high density of coniferous trees. A buffer zone of 5 m would help reduce the error of 35% and 42% respectively in height estimation for all trees and in volume estimation for broadleaved trees. © 2018 INIA.