Loading...
Pubblicazioni Scientifiche
Filtri di ricerca 30 risultati
Pubblicazioni per anno
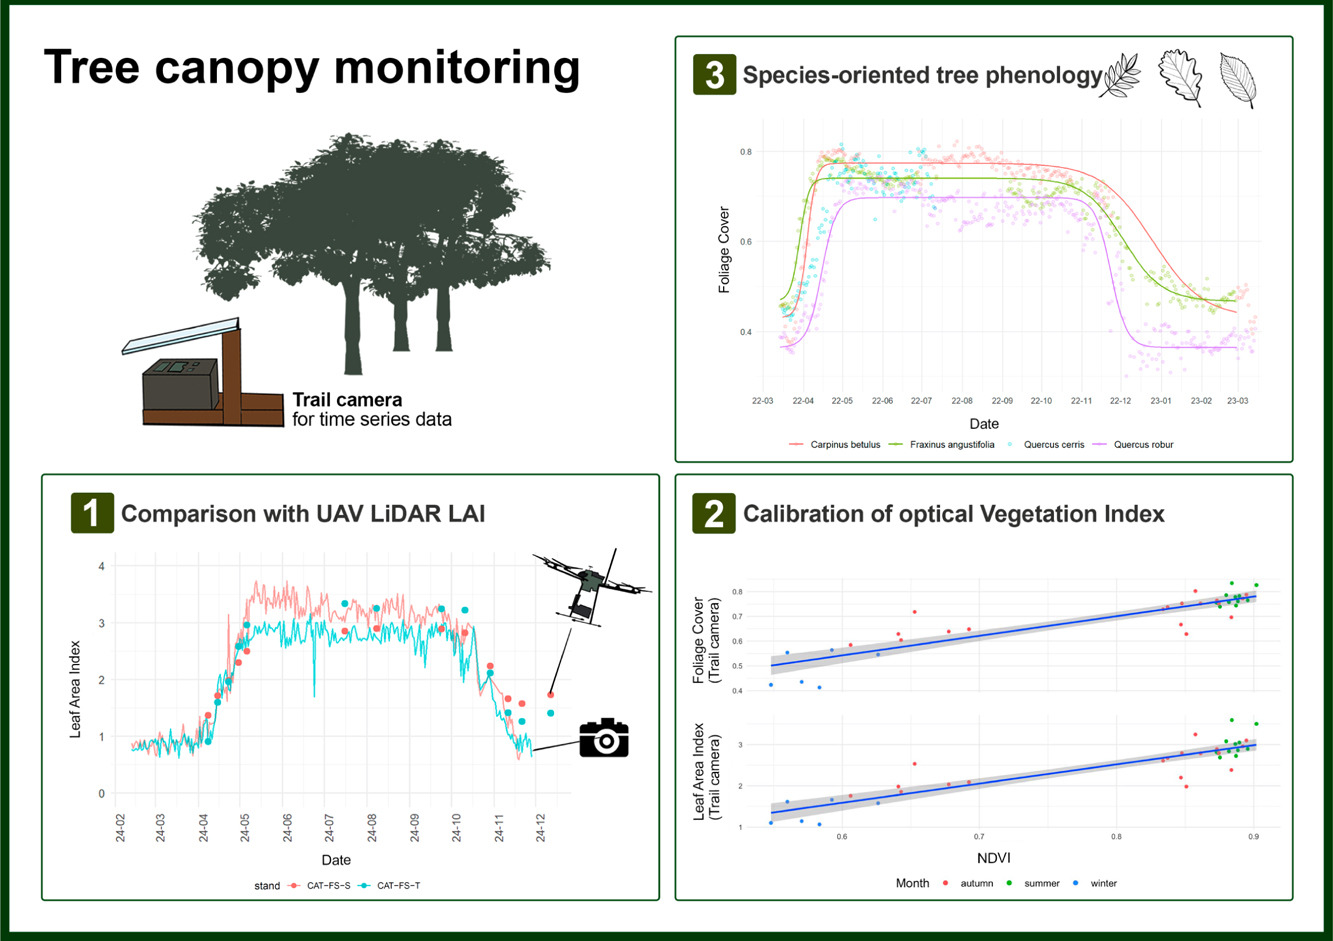
CrowNet: a trail-camera canopy monitoring system
Chianucci
,
Francesco
,
Lenzi
,
Alice
,
Minari
,
Emma
,
Guasti
,
Matteo
,
Gisondi
,
Silvia
,
Gonnelli
,
Marco
,
Innocenti
,
Simone
,
Ferrara
,
Carlotta
,
Campanaro
,
Alessandro
,
Ciampelli
,
Paola
,
Cutini
,
Andrea
,
Puletti
,
Nicola
Mostra abstract
Continuous monitoring of forest canopy structure and phenology is pivotal for the assessment of ecosystem responses to environmental variability and changes. The present study evaluated the use of repeat digital trail cameras as a low-cost, flexible, and accessible in situ monitoring solution for quantifying daily canopy attributes, including effective leaf area index (Le) and canopy cover. A trial camera monitoring network (CrowNet) was established encompassing 20 forest stands in Italy, under different management and environmental conditions, resulting in over 44,000 daily images collected over three years. We demonstrated that taking the mean daily canopy attribute allowed to obtain smooth time series from trail cameras, from which phenological transition dates can be inferred. Daily canopy attributes were validated against manual digital cover photography measurement. To further explore the applicability of this monitoring solution, we performed a comparison between daily Le time series derived from a subset of trail cameras located in beech forests and data collected by multitemporal UAV LiDAR. Results demonstrated the close agreement between the two methods across the entire phenological period (start and end of season). We also illustrated use of continuous trail camera estimates to calibrate a vegetation index (NDVI) to infer leaf area and canopy cover from optical multi-temporal UAV data. We further investigated use of trail camera to detect species-specific differences in tree phenology from time series acquired in a mixed oak-hornbeam forest. We found different canopy structure and phenological transition dates in three broadleaved species (oak, ash, hornbeam), supporting the effectiveness of trail cameras for species-oriented phenology monitoring. We conclude that trail cameras provide a reliable solution for daily canopy monitoring, offering a significant cost-effective and flexible alternative to traditional field methods and providing potential to calibrate, validate or integrate remotely-sensed information. However, camera failures during adverse weather, and the need for more efficient image data quality checking procedures, still represent open challenges. Future improvements, such as weatherproof housing and automated pre-processing screening procedures, are therefore recommended for making trail camera fully operational in ground canopy and phenology monitoring. © 2025 Elsevier B.V.

Improving Aboveground Biomass Estimation in Beech Forests with 3D Tree Crown Parameters Derived from UAV-LS
Mostra abstract
Accurate estimates of aboveground biomass (AGB) are essential for forest policies to reduce carbon emissions. Unmanned aerial laser scanning (UAV-LS) offers unprecedented millimetric detail but is underutilized in monitoring broadleaf Mediterranean forests compared to coniferous ones. This study aims to design and evaluate a procedure for AGB estimates based on the predictive power of crown features. In the first step, we manually created Quantitative Structure Models (QSMs) for 320 trees using data from UAV laser scanning (UAV-LS), airborne laser scanning (ALS), and co-registered terrestrial laser scanning (TLS). This provided the most accurate non-destructive estimate of aboveground biomass (AGB) in the absence of destructive measurements. For each reference tree we also measured crown projection and crown volume to build two separated models relating AGB to such crown features. In the second phase, we evaluated the potential of UAV-LS for quantifying AGB in a pure European beech (Fagus sylvatica) forest and compared it with traditional ALS estimates, using fully automatic procedures. The two obtained tree-level AGB models were then tested using three datasets derived from 35 sampling plots over the same study area: (a) 1130 trees manually segmented (phase-2 reference); (b) trees automatically extracted from ALS data; and (c) trees automatically extracted from UAV-LS data. Results demonstrate that detailed UAV-LS data improve model sensitivity compared to ALS data (RMSE = 45.6 Mg ha<sup>−1</sup>, RMSE% = 13.4%, R2 = 0.65, for the best ALS model; RMSE = 44.0 Mg ha<sup>−1</sup>, RMSE% = 12.9%, R2 = 0.67, for the best UAV-LS model), allowing for the detection of AGB differences even in quite homogenous forest structures. Overall, this study demonstrates the combined use of both laser scanner data can foster non-destructive and more precise AGB estimation than the use of only one, in forested areas across hectare scales (1 to 100 ha). © 2025 by the authors.
LAIr: an R package to estimate LAI from Normalized Difference Vegetation Index
Bajocco
,
Sofia
,
Ferrara
,
Carlotta
,
Savian
,
Francesco
,
Ginaldi
,
Fabrizio
,
Puletti
,
Nicola
,
Crecco
,
Lorenzo
,
Bregaglio
,
Simone Ugo Maria
,
Chianucci
,
Francesco
Mostra abstract
Leaf area index (LAI) is an important biophysical parameter describing vegetation. LAI is typically retrieved from optical remote sensing by empirical models relating LAI to vegetation indices, such as the Normalized Difference Vegetation Index (NDVI). As the relationship between LAI and NDVI is non-linear and crop type dependant, several specific empirical equations relating LAI to NDVI have been developed using field data. This study presented LAIr, an R package to derive LAI from NDVI data from the most comprehensive library of conversion equations. In the package, the range of functions differs on environmental factors, sensors, and vegetation types, allowing flexibility in choosing appropriate options based on specific application, scale of investigation and data availability. We illustrated the use of the package with a case study to compare a generic LAI product with specific NDVI-based LAI estimations. By leveraging empirical knowledge, LAIr enables accurate and context-specific estimation of LAI. The deployment of an open-source R package serves as a valuable tool for aiding researchers in selecting the most appropriate equations for conducting NDVI-to-LAI conversion. © 2024
Moths in space: The below-canopy structure of forest drives abundance and mobility-related traits of moth communities
La Cava
,
Sara
,
Rijllo
,
Giuseppe
,
Zucco
,
Giada
,
Innocenti
,
Simone
,
Guasti
,
Matteo
,
Puletti
,
Nicola
,
Ferrara
,
Carlotta
,
Scalercio
,
S.
Mostra abstract
The distribution of species is primarily driven by the availability of trophic resources. In a given forest type, insects trophically related to the dominant tree are expected to be evenly distributed due to the abundance of their foodplant. However, their distribution is also influenced by complex relationships with abiotic and biotic parameters such as available space, predatory pressure, and morphometric traits. In this study, we investigated how the three-dimensional structure of space below the canopy may affect the composition of nocturnal lepidoptera communities. To synthesise the complexity of the dispersal behaviour of these insects, we evaluated easily measurable traits such as wingspan and the presence of tympanic organs, both connected to their mobility and thus potentially influenced by the structure of the available flight space. The study was conducted in the Sila National Park (Italy), where 12 sampling sites were selected in pine forests and an additional 12 in beech forests. Forest spatial structure was investigated using a portable terrestrial laser scanner. Moths were sampled monthly using light traps from May to October in both 2019 and 2020. Among measured forest traits, we observed that the space above three meters from the ground is the only factor influencing community composition. Larger species with tympanic organs prefer environments with less space below tree canopies. Our findings could be the starting point for future studies that investigate a potential defence strategy of moths against bats, as tympanate and larger species not only actively avoid chiropter predation but could also choose denser forests because of a lower bat activity. Moths' distribution and community composition thus appear to be significantly shaped by the spatial structure of forests. © 2024 Elsevier B.V.
Mapping Understory Vegetation Density in Mediterranean Forests: Insights from Airborne and Terrestrial Laser Scanning Integration
forest biodiversity
lidar
terrestrial laser scanner
forest structure
spatial prediction
voxelization
Mostra abstract
The understory is an essential ecological and structural component of forest ecosystems. The lack of efficient, accurate, and objective methods for evaluating and quantifying the spatial spread of understory characteristics over large areas is a challenge for forest planning and management, with specific regard to biodiversity and habitat governance. In this study, we used terrestrial and airborne laser scanning (TLS and ALS) data to characterize understory in a European beech and black pine forest in Italy. First, we linked understory structural features derived from traditional field measurements with TLS metrics, then, we related such metrics to the ones derived from ALS. Results indicate that (i) the upper understory density (5–10 m above ground) is significantly associated with two ALS metrics, specifically the mean height of points belonging to the lower third of the ALS point cloud within the voxel (HM<inf>1/3</inf>) and the corresponding standard deviation (SD<inf>1/3</inf>), while (ii) for the lower understory layer (2–5 m above ground), the most related metric is HM<inf>1/3</inf> alone. As an example application, we have produced a map of forest understory for each layer, extending over the entire study region covered by ALS data, based on the developed spatial prediction models. With this study, we also demonstrated the power of hand-held mobile-TLS as a fast and high-resolution tool for measuring forest structural attributes and obtaining relevant ecological data. © 2023 by the authors.
coveR: an R package for processing digital cover photography images to retrieve forest canopy attributes
Mostra abstract
Key message: coveR is an R package for estimating canopy attributes from digital cover photography (DCP) images. The simplicity of the method and the open-accessibility of coveR can effectively extend the accessibility and applicability of DCP to a wider audience. Abstract: Digital cover photography (DCP) is an increasingly popular tool for estimating canopy cover and leaf area index (LAI). However, existing solutions to process canopy images are predominantly tailored for hemispherical photography, whereas open-access tools for DCP are lacking. We developed an R package (coveR) to support the whole processing of DCP images in an automated, fast, and reproducible way. The package functions, which are designed for step-by-step single-image analysis, can be performed sequentially in a pipeline while ensuring quality-checking of each processing step. A wrapper function ‘coveR()’ is also created to perform all the image processing workflow in a single function. A case study is presented to demonstrate the reliability of canopy attributes derived from coveR in pure beech (Fagus sylvatica L.) stands with variable canopy density and structure. Estimates of gap fraction and effective LAI from DCP were validated against reference measurements obtained from terrestrial laser scanning. By providing a simple, transparent, and flexible image processing procedure, coveR supported the use of DCP for routine measurements and monitoring of forest canopy attributes. This, combined with the possibility to implement DCP in many devices, including smartphones, micro-cameras, and remote trail cameras, can greatly expand the accessibility of the method also by non-experts. © 2022, The Author(s), under exclusive licence to Springer-Verlag GmbH Germany, part of Springer Nature.
Enhancing wall-to-wall forest structure mapping through detailed co-registration of airborne and terrestrial laser scanning data in Mediterranean forests
Mostra abstract
This paper presents a new co-registration procedure of complementary point clouds captured by both Terrestrial (TLS) and Airborne Laser Scanning (ALS) technologies. Starting from the geographic position of the TLS point cloud, a geometric features recognition algorithm, which evaluates digital terrain models obtained from both ALS and TLS, was developed and implemented in a new GIS software (ForeSight®). As a case study, we tested this new approach using point clouds acquired from both hand-held mobile TLS and ALS sensors over 24 test sites located in a protected area in southern Italy, with the ultimate goal of characterizing the different forest stand structures. From each aligned point cloud, a plot-level spatially explicit index (Enhanced Structural Spatial Index, ESCI) was derived to assess the three-dimensional structure of the considered forest stands. Then, we compared structural features derived from the ESCI index with different computed ALS metrics. Finally, the most correlated ALS metrics were used as predictors to produce an ESCI-map of the entire region of interest. © 2021 Elsevier B.V.
Estimated biomass loss caused by the vaia windthrow in northern italy: Evaluation of active and passive remote sensing options
Vaglio Laurin
,
Gaia
,
Puletti
,
Nicola
,
Tattoni
,
Clara
,
Ferrara
,
Carlotta
,
Pirotti
,
Francesco
Mostra abstract
Windstorms are a major disturbance factor for European forests. The 2018 Vaia storm, felled large volumes of timber in Italy causing serious ecological and financial losses. Remote sensing is fundamental for primary assessment of damages and post‐emergency phase. An explicit estimation of the timber loss caused by Vaia using satellite remote sensing was not yet undertaken. In this investigation, three different estimates of timber loss were compared in two study sites in the Alpine area: pre‐existing local growing stock volume maps based on lidar data, a recent national‐level forest volume map, and an novel estimation of AGB values based on active and passive remote sensing. The compared datasets resemble the type of information that a forest manager might potentially find or produce. The results show a significant disagreement in the different biomass estimates, related to the methods used to produce them, the study areas characteristics, and the size of the damaged areas. These sources of uncertainty highlight the difficulty of estimating timber loss, unless a unified national or regional European strategy to improve preparedness to forest hazards is defined. Considering the frequent impacts on forest resources that occurred in the last years in the European Union, remote sensing‐based surveys targeting forests is urgent, particularly for the many European countries that still lack reliable forest stocks data. © 2021 by the authors. Licensee MDPI, Basel, Switzerland.
Characterizing subcanopy structure of Mediterranean forests by terrestrial laser scanning data
forest biodiversity
lidar
terrestrial laser scanner
forest structure
spatial prediction
voxelization
Mostra abstract
Vegetation structure is one of the key factors in forest ecosystems. Especially understory structure has major implications for wildlife habitat selection, reproduction, and survival. Structural indices traditionally used to characterize understory vegetation are based on field vegetation surveys describing general features such as leaf area index (LAI), canopy cover or vegetation height, hiding much of the three-dimensional vegetation structure complexity. The application of terrestrial laser scanning (TLS) in forest ecological and management applications is becoming more effective. In this study, we use TLS data to quantify spatial attributes of forest subcanopy in four different forest strata ranging from 0.5 m to 10 m from the ground. We collected data in 12 plots of mature European beech (Fagus sylvatica L.) forests and 12 plots of mature black pine (Pinus nigra subsp. laricio Maire) forests, located in the Sila National Park, Italy. We propose a TLS-based approach to estimate a fine-scale vegetation density using the Plant Density Index (PDI) and to test the PDI at different height classes. We found a significant relationship between the PDI and the number of trees belonging to the dominant layer, using the Spearman correlation coefficient (r = 0.83, p<inf>val</inf> = 0.001). Basing on PDI values, a cluster analysis of the four subcanopy strata was carried out for deriving clusters of structurally homogeneous forest plots. Results identified three clusters in terms of the vegetation features in the horizontal height classes: the first cluster primarily includes Beech forests characterized by plots with the highest tree densities; the second one includes both Beech and Pine forests characterized by dense ground vegetation and shrubs and an intermediate tree density; the third group is represented by Pine forests with massive presence of vegetation lower strata and moderate tree density. Then, PCA allowed identifying the relationship between the considered subcanopy layers and forest plots. © 2021 Elsevier B.V.
Traditional and TLS-based forest inventories of beech and pine forests located in Sila National Park: A dataset
Mostra abstract
Vegetation structure is a key determinant of species distribution and diversity. Compared to traditional methods, the use of Terrestrial Laser Scanning (TLS) has allowed massive amounts of point cloud data collected for quantifying three-dimensional habitat properties at increasing spatial and temporal scales. We used TLS to characterize the forest plots across a broad range of forest structural diversity, located in the Sila National Park, South Italy. The dataset reports data collected in 24 15-m-radius circular plots, 12 of which were dominated by beech (Fagus sylvatica L.) and 12, by black pine (Pinus nigra subsp. laricio). In detail, this work provides dataset of i) plot-level attributes calculated from raw data, such as the number of trees, ii) tree-level data, comprising a total of 1709 trees, with information related to field-based forest inventory such as the diameter at breast height (DBH), and iii) plot-level information related to the time for conducting both traditional field- and TLS-based forest inventories. Compared to traditional methods, the use of TLS allows a very high-resolution quantification of the 3D forest structural properties, also reducing the time for conducting forest inventories. © 2020
Influence of voxel size and point cloud density on crown cover estimation in poplar plantations using terrestrial laser scanning
Mostra abstract
Accurate estimates of crown cover (CC) are central for a wide range of forestry studies. As direct measurements do not exist to retrieve this variable in the field, CC is conventionally determined from optical measurements as the complement of gap fraction close to the zenith. As an alternative to passive optical measurements, active sensors like terrestrial Light Detection And Ranging (LiDAR) allows for characterizing the 3D canopy structure with unprecedented detail. We evaluated the reliability of terrestrial LiDAR (TLS) to estimate CC using a voxel-based approach. Specifically, we tested how different voxel sizes (ranging from 5-20 cm) and voxel densities (1-9 points/dm<sup>3</sup>) influenced the retrieval of CC. Results were compared against benchmark values obtained from digital cover photography (DCP). The trial was performed in hybrid poplar plantations in Northern Italy. Results indicate that TLS can be used for obtaining accurate estimates of CC, but the choice of voxel size and point density is critical for achieving such accuracy. In hybrid poplars, the best performance was obtained using voxel size of 10 cm and point density of 8 points/dm<sup>3</sup>. The combined ability of measuring and mapping CC also holds great potential to use TLS for calibrating and upscaling results using coarser-scale remotely sensed products. © 2021 Centro di Ricerca per la Selvicoltura, Consiglio per la Ricerca in Agricoltura e l'Analisi dell'Economia Agraria. All rights reserved.
Nondestructive tree stem and crown volume allometry in hybrid poplar plantations derived from terrestrial laser scanning
Chianucci
,
Francesco
,
Puletti
,
Nicola
,
Grotti
,
Mirko
,
Ferrara
,
Carlotta
,
Giorcelli
,
Achille
,
Coaloa
,
Domenico
,
Tattoni
,
Clara
Mostra abstract
Accurate and frequently updated tree volume estimates are required for poplar plantations, which are characterized by fast growth rate and short rotation. In this study, we tested the potential of terrestrial laser scanning (TLS) as a reliable method for developing nondestructive tree volume allometries in poplar plantations. The trial was conducted in Italy, where 4- to 10-year-old hybrid plantations were sampled to develop tree crown volume allometry in leaf-on conditions, tree stem volume, and height-diameter allometries in leaf-off conditions. We tested one-entry models based on diameter and two-entry models based on both diameter and height. Model performance was assessed by residual analysis. Results indicate that TLS can provide accurate models of tree stem and crown volume, with percentage of root-mean-square error of about 20 percent and 15 percent, respectively. The inclusion of height does not bring relevant improvement in the models, so that only diameter can be used to predict tree stem and crown volume. The TLS-measured stem volume estimates agreed with an available formula derived from harvesting. We concluded that TLS is a reliable method for developing nondestructive volume allometries in poplar plantations and holds great potential to enhance conventional tree inventory and monitoring. © The Author(s) 2020. Published by Oxford University Press on behalf of the Society of American Foresters. All rights reserved.
Lidar-based estimates of aboveground biomass through ground, aerial, and satellite observation: A case study in a Mediterranean forest
aboveground biomass
global ecosystem dynamics investigation mission
light detection and ranging
mobile terrestrial laser scanner
Mostra abstract
Light detection and ranging (Lidar) is considered the most advanced technology to assess forest aboveground biomass (AGB). Currently, this technology is shared by different sensors ranging from ground [terrestrial laser scanning (TLS)], airborne [aerial laser scanning (ALS)] up to spaceborne ones, which entail different spatial scales. However, few studies tested the simultaneous and combined use of Lidar to estimate AGB, linking ground measurements up to satellite observations. To fill this gap, we performed a study in two Mediterranean forest types [i.e., mountainous beech (Fagus sylvatica) and black pine (Pinus nigra subsp. laricio)] with contrasting structures (i.e., broadleaf versus needleleaf forests), where field inventory, TLS, ALS, and the recent spaceborne Global Ecosystem Dynamics Investigation (GEDI) data were simultaneously acquired. A three-step procedure was followed, which involved (i) the validation of AGB estimates obtained from TLS against reference values obtained from conventional field inventory; (ii) the calibration and validation of AGB estimates derived from ALS against TLS measurements, and (iii) the calibration and validation of AGB estimates derived from GEDI against mapped AGB values obtained from ALS. Our main results indicated that TLS provides consistent measurements of AGB as compared with field measurements (R2 ranged between 0.6 and 0.9 and root-mean-square error ranged between 29% and 49%), indicating its potential as ground reference for airborne Lidar observations. The combined availability of ground, airborne, and spaceborne observations is suitable to link ground measurements up to satellite observations. Differences in Lidar performance between needleleaf and broadleaf forests are also considered and discussed. © 2020 Society of Photo-Optical Instrumentation Engineers (SPIE).
An intensity, image-based method to estimate gap fraction, canopy openness and effective leaf area index from phase-shift terrestrial laser scanning
Grotti
,
Mirko
,
Calders
,
Kim
,
Origo
,
Niall
,
Puletti
,
Nicola
,
Alivernini
,
Alessandro
,
Ferrara
,
Carlotta
,
Chianucci
,
Francesco
Mostra abstract
Accurate in situ estimates of leaf area index (LAI) are essential for a wide range of ecological studies and applications. Due to the destructiveness and impracticality of direct measurements, indirect optical methods have mostly been used in the field to derive estimates of LAI from gap fraction measurements. Terrestrial laser scanning (TLS) is strongly supporting use of this active technology, which possesses several advantages compared to passive sensors. However, edge effects and partial beam interceptions are significantly challenges for the accurate retrieval of gap fraction from 3D point cloud data available from TLS, particularly in phase-shift instruments, which in turns require point cloud filtering to correct erroneous point measurements. As the limitations above influences the point cloud, we proposed a new method which is based only on the laser return intensity (LRI) information derived from raw TLS data, which are used to generate 2D intensity images. The intensity image contains all the unfiltered LRI information captured by TLS, which is used to separate gap from non-gap pixels, using a procedure comparable to the standard image analysis processing of digital hemispherical images. This allows a theoretically consistent comparison between active and passive optical measurements of gap fraction across all the zenith angle range. The method was tested in real and simulated forests. Gap fraction, canopy openness and effective leaf area index derived from real and simulated intensity TLS images were compared with those obtained using digital hemispherical photography (DHP). Results indicated that the intensity, image-based method outperformed DHP, as the higher pixel resolution of the intensity images and the larger distance covered by TLS allowed detection of many small canopy elements, particularly at higher zenith angles (longer optical distance), which are not detected in DHP. The main findings support the reliability of the intensity, image-based method to standardize protocols for TLS phase-shift scan data processing and use of the produced canopy estimates as a benchmark for passive optical measurements. © 2019 Elsevier B.V.
Intra-annual raw basal area increments (early-wood and late-wood) of Pinus nigra subsp. laricio Poiret trees from southern Italy at the pines׳ mesic to xeric distribution range
Mazza
,
Gianluigi
,
Sarris
,
Dimitrios
,
Chiavetta
,
U.
,
Ferrara
,
Rossana Monica
,
Rana
,
Gianfranco
forestry
annual growth
basal-area increments
black pines
even-aged forest stands
growth response
narrow distribution
p. nigra
pinus nigra
southern italy
tree ring data
wood
Mostra abstract
This article contains tree rings data related to the research article entitled “An intra-stand approach to identify intra-annual growth responses to climate in Pinus nigra subsp. laricio Poiret trees from southern Italy” (Mazza et al., 2018). Most dendroclimatological studies on black pine have been conducted on the P. nigra subsp. nigra, while only few results on climate-growth relationships are available for other taxa such as P. nigra subsp. laricio, which has the narrowest distribution range of the collective species P. nigra. This data article provides tree rings data for the subsp. laricio at an intra-annual growth level, distinguishing early-wood (EW) and late-wood (LW), from an even aged forest stand from the Sila mountain area within the subspecies mesic to xeric distribution range. © 2018
An intra-stand approach to identify intra-annual growth responses to climate in Pinus nigra subsp. laricio Poiret trees from southern Italy
Mazza
,
Gianluigi
,
Sarris
,
Dimitrios
,
Chiavetta
,
U.
,
Ferrara
,
Rossana Monica
,
Rana
,
Gianfranco
climate-growth relationships
mediterranean pine forests
standardization methods
tree rings analysis
water utilization
Mostra abstract
The growth of Pinus nigra tree stands is known to be limited by spring-summer precipitation (P). We explored the intra-annual growth dynamics (early-wood EW and late-wood LW of tree-rings) and their responses to climate (in monthly, seasonal and annual scale) in Pinus nigra subsp. laricio at the intra-stand level in Calabria, at the pines' mesic to xeric distribution range. We used a variety of age detrending methods to assess how the adaptive potential to climate change of each tree varies within the even-aged forest stand. In years of wet climate, when precipitation (P) could infiltrate deeper below ground, higher growth rates occurred in 83% of trees, best explained by P accumulated over several previous years. The variability of EW increment was best explained by 3–5 previous year P (including the growth year) in 61% of trees, while LW increment was best explained by 1–3 year P in 78% of trees. This would suggest that in wet years most trees utilized not only surface but also deeper moisture pools using their taproot to produce both EW and LW. In contrast, during dry years, for 39% of trees the most significant predictor for EW was June rainfall. August P explained LW variability in 35% of the trees, while the influence of 1–3 year P on LW was reduced to 48%. Thus, under a drier climate ca. 1/3 of the trees within the stand significantly reduced their capacity to utilize deeper ground moisture, indicating higher vulnerability to drought stress. Multiple-year P appeared as the main climatic driver for growth in most trees, but only became evident through age detrending methods retaining low frequency growth variability. Our findings are the first to provide such insight into the wide spectrum of climatic factors that may drive P. laricio's inter-stand and inter-annual productivity. They also assist to identify the most vulnerable trees to drought stress within a forest stand. Such information could prove very useful in the application of silvicultural treatments (e.g., selective thinning) aiming to increase the resilience of tree stands to future drought intensification. © 2018 Elsevier B.V.
Silvicultural regime shapes understory functional structure in European forests
Chianucci
,
Francesco
,
Napoleone
,
Francesca
,
Ricotta
,
Carlo
,
Ferrara
,
Carlotta
,
Fusaro
,
Lina
,
Balducci
,
Lorenzo
,
Trentanovi
,
Giovanni
,
Bradley
,
Owen
,
Kovács
,
Bence
,
Mina
,
Marco
,
Cerabolini
,
Bruno Enrico Leone
,
Vandekerkhove
,
Kris
,
de Smedt
,
Pallieter
,
Lens
,
Luc
,
Hertzog
,
Lionel R.
,
Verheyen
,
Kris
,
Hofmeister
,
Jeňýk
,
Hošek
,
Jan
,
Matula
,
Radim
,
Doerfler
,
Inken
,
Müller
,
Jörg C. C.
,
Weisser
,
Wolfgang W.
,
Helback
,
Jan
,
Schall
,
Peter
,
Fischer
,
Markus
,
Heilmann-Clausen
,
Jacob
,
Riis-Hansen
,
Rasmus
,
Goldberg
,
Irina
,
Aude
,
Erik
,
Kepfer-Rojas
,
Sebastian
,
Kappel Schmidt
,
Inger
,
Riis-Nielsen
,
Torben
,
Mårell
,
Anders
,
Dumas
,
Yann
,
Janssen
,
Philippe
,
Paillet
,
Yoan
,
Archaux
,
Frédéric
,
Xystrakis
,
Fotios
,
Tinya
,
Flóra
,
Ódor
,
Péter
,
Aszalós
,
Réka
,
Bölöni
,
János
,
Cutini
,
Andrea
,
Bagella
,
Simonetta
,
Sitzia
,
Tommaso
,
Brazaitis
,
Gediminas
,
Marozas
,
Vitas
,
Ujházyová
,
Mariana
,
Ujházy
,
Karol
,
Máliš
,
František
,
Nordén
,
Björn
,
Burrascano
,
Sabina
functional diversity
functional redundancy
forest understory
sustainable forest management
unmanaged forests
ecosystem resilience
silvicultural regime
Mostra abstract
Managing forests to sustain their diversity and functioning is a major challenge in a changing world. Despite the key role of understory vegetation in driving forest biodiversity, regeneration and functioning, few studies address the functional dimensions of understory vegetation response to silvicultural management. We assessed the influence of the silvicultural regimes on the functional diversity and redundancy of European forest understory. We gathered vascular plant abundance data from more than 2000 plots in European forests, each associated with one out of the five most widespread silvicultural regimes. We used generalized linear mixed models to assess the effect of different silvicultural regimes on understory functional diversity (Rao's quadratic entropy) and functional redundancy, while accounting for climate and soil conditions, and explored the reciprocal relationship between three diversity components (functional diversity, redundancy and dominance) across silvicultural regimes through a ternary diversity diagram. Intensive silvicultural regimes are associated with a decrease in functional diversity and an increase in functional redundancy, compared with unmanaged conditions. This means that although intensive management may buffer communities' functions against species or functional losses, it also limits the range of understory response to environmental changes. Policy implications. Different silvicultural regimes influence different facets of understory functional features. While unmanaged forests can be used as a reference to design silvicultural practices in compliance with biodiversity conservation targets, different silvicultural options should be balanced at landscape scale to sustain the multiple forest functions that human societies are increasingly demanding. © 2024 The Author(s). Journal of Applied Ecology published by John Wiley & Sons Ltd on behalf of British Ecological Society.
On the temporal mismatch between in-situ and satellite-derived spring phenology of European beech forests
Mostra abstract
Forest phenology plays a key role in the global terrestrial ecosystem influencing a range of ecosystem processes such as the annual carbon uptake period, and many food webs and changes in their timing and progression. The timing of the start of the phenology season has been successfully determined at a range of scales, from the individual tree by in situ observations to landscape and continental scales by using remotely sensed vegetation indices (VIs). The spatial resolution of satellites is much coarser than traditional methods, creating a gap between space-borne and actual field observations, which brings limitations to phenological research at the ecosystem level. Several unconsidered methodological and observational-related limitations may lead to misinterpretation of the timing of the satellite-derived signals. The aim of this study is therefore to clarify the meaning of a set of spring phenology metrics derived from Moderate Resolution Imaging Spectroradiometer (MODIS) Enhanced Vegetation Index (EVI) time series in beech forests distributed across Europe with respect to PEP725 in situ observations, from 2003 to 2020. To this aim, we (i) tested the differences between remotely sensed and in situ start-of-season (SOS) metrics and (ii) quantified the influence of latitude, elevation, temperature, and precipitation on such differences. Results demonstrated that there is a clear temporal gradient among the different SOS metrics, all of them occurring prior to the in situ observations. Furthermore, latitude and temperatures proved to be the main factors guiding the differences between remotely sensed and in situ SOS metrics. Evidence from this study may help in recognizing the actual meaning of what we see by means of remotely sensed phenology metrics. In this perspective, field observations are crucial in understanding phenology events and provide a reference base. Satellite data, on the other hand, complement field observations by filling in gaps in spatial and temporal coverage, thus enhancing the overall understanding. © 2023 The Author(s). Published by Informa UK Limited, trading as Taylor & Francis Group.
Testing an expanded set of sustainable forest management indicators in Mediterranean coppice area
Cutini
,
Andrea
,
Ferretti
,
Marco
,
Bertini
,
Giada
,
Brunialti
,
Giorgio
,
Bagella
,
Simonetta
,
Chianucci
,
Francesco
,
Fabbio
,
Gianfranco
,
Fratini
,
Roberto
,
Riccioli
,
Francesco
,
Caddeo
,
C.
,
Calderisi
,
Marco
,
Ciucchi
,
B.
,
Corradini
,
Stefano
,
Cristofolini
,
Fabiana
,
Cristofori
,
Antonella
,
Di Salvatore
,
Umberto
,
Ferrara
,
Carlotta
,
Frati
,
Luisa
,
Landi
,
Sara
,
Marchino
,
Luca
,
Patteri
,
Giacomo
,
Piovosi
,
Maurizio
,
Roggero
,
Pier Paolo
,
Seddaiu
,
Giovanna
,
Gottardini
,
Elena
silviculture
coppice conversion
coppice natural evolution
coppice system
environmental monitoring
sfm criteria
Mostra abstract
Although coppice forests represent a significant part of the European forest area, especially across southern Countries, they received little attention within the Sustainable Forest Management (SFM) processes and scenarios, whose guidelines have been mainly designed to high forests and national scale. In order to obtain “tailored” information on the degree of sustainability of coppices on the scale of the stand, we evaluated (i) whether the main coppice management options result in different responses of the SFM indicators, and (ii) the degree to which the considered SFM indicators were appropriate in their application at stand level. The study considered three different management options (Traditional Coppice TC, coppice under Natural Evolution NE, and coppice under Conversion to high forest by means of periodical thinning CO). In each of the 43 plots considered in the study, which covered three different European Forest Types, we applied a set of eighteen “consolidated” SFM indicators, covering all the six SFM Criteria (FOREST EUROPE, 2020) and, additionally, tested other sixteen novel indicators shaped for agamic forests and/or applicable at stand level. Results confirmed that several consolidated indicators related to resources status (Growing stock and Carbon stock), health (Defoliation and Forest damage), and socio-economic functions (Net revenue, Energy and Accessibility) were highly appropriate for evaluating the sustainability of coppice at stand level. In addition, some novel indicators related to resources status (Total above ground tree biomass), health (Stand growth) and protective functions (Overstorey cover and Understorey cover) proved to be highly appropriate and able to support the information obtained by the consolidated ones. As a consequence, a subset of consolidated SFM indicators, complemented with the most appropriate novel ones, may represent a valid option to support the evaluation of coppice sustainability at stand level. An integrated analysis of the SFM indicators showed that NE and CO display significant higher environmental performances as compared with TC. In addition, CO has positive effects also on socio-economic issues, while TC -which is an important cultural heritage and a silvicultural option that may help to keep local communities engaged in forestry – combines high wood harvesting rates with dense understory cover. Overall, each of the three management options showed specific sustainability values; as a consequence, their coexistence at a local scale and in accordance with the specific environmental conditions and the social-economic context, is greatly recommended since it may fulfill a wider array of sustainability issues. © 2021
Continuous observations of forest canopy structure using low-cost digital camera traps
Mostra abstract
Assessing forest canopy dynamics is crucial for understanding the response of vegetation to environmental variability and change. While digital repeat photography is gaining increased attention for obtaining field phenology observations, colour indices derived from this method are often affected by leaf colour and actual canopy structure, complicating the physical interpretation of results. In addition, repeated photography requires power, storage capacity and remote data transfer, which are often limited in forest conditions. As an alternative, we tested a simple, cheap and fast solution to derive daily canopy structure observation from digital camera traps (CTs). Formerly deployed for wildlife monitoring, CTs are low-cost digital cameras designed for outdoor conditions and have low battery consumption, enable repeat acquisition, and often feature remote data transfer protocols. The trial was performed in a deciduous oak stand, where continuous images were acquired over a 1-year period using the time-lapse feature of the CT. Daily time series of canopy structure attributes were derived from the collected images using simple and automated procedures. Results were validated against reference manual cover photography measurements. The daily time series of foliage cover and leaf area index were then used to derive phenological transition dates, which were compared against phenological observations obtained from satellite Sentinel-2 data. Results indicated that field and satellite data provided comparable accuracy in determining the start of season (SOS). Larger discrepancies were found in determining the end of season (EOS), which can be attributed to the low number of good quality autumn images available from the satellite data. We concluded that CT is a robust method, which is ideally suited for routine, continuous field monitoring of canopy attributes and phenology. While this method can be used for evaluating remote sensing observations, the combination of CTs with satellite data holds great potential for greater spatiotemporal coverage, from field to landscape scales. © 2021
Evaluating sampling schemes for quantifying seed production in beech (Fagus sylvatica) forests using ground quadrats
Chianucci
,
Francesco
,
Tattoni
,
Clara
,
Ferrara
,
Carlotta
,
Ciolli
,
Marco
,
Brogi
,
Rudy
,
Zanni
,
Michele
,
Apollonio
,
Marco
,
Cutini
,
Andrea
Mostra abstract
Accurate estimates of seed production are central for understanding mast seeding mechanisms at tree and forest scales, and for designing sustainable management strategies. As trees are long-lived organisms, a long-term perspective is required to understand how reproduction acts during the life cycle of a tree. However, long-term series of seed production are challenging to obtain, as the available seed count procedures strictly rely on field methods, which are cost- and time-consuming, inherently limiting their widespread use at extensive spatial and temporal scales. In this study, we proposed a simple, rapid and flexible field method based on counting the seed in mobile ground quadrats (GQ), which was tested in beech forests. Quadrat measurements were first validated against reference measurements obtained from litter traps (LT) in three permanent plots. Results indicated that GQ provides robust and reliable estimates of seeds, which are not affected by seed predation occurring at the forest floor. Additional quadrat measurements were performed to evaluate the influence of sampling schemes (random, regular, systematic) on the estimation of mean seed production at the plot scale. One hundred quadrats were collected in 0.25 ha beech plots and considered as a reference for evaluating the different sampling schemes and sampling sizes. Measurements were performed in October (three plots), which represented the peak of seed fall, and November (two plots). Results indicate that about 25 randomly located measurements allowed to characterize plot-level mean seed production with an acceptable error below 20%, regardless of the different mean seed production observed between the studied plots and the sampling periods. If the 25 sampling points are arranged in a grid, the obtained mean estimates are within the confidence interval of the reference plot-level values. © 2021 Elsevier B.V.
A comparison of ground-based count methods for quantifying seed production in temperate broadleaved tree species
Tattoni
,
Clara
,
Chianucci
,
Francesco
,
Ciolli
,
Marco
,
Ferrara
,
Carlotta
,
Marchino
,
Luca
,
Zanni
,
Michele
,
Zatelli
,
Paolo
,
Cutini
,
Andrea
Mostra abstract
• Key message: Litter trap is considered the most effective method to quantify seed production, but it is expensive and time-consuming. Counting fallen seeds using a quadrat placed on the ground yields comparable estimates to the litter traps. Ground quadrat estimates derived from either visual counting in the field or image counting from quadrat photographs are comparable, with the latter being also robust in terms of user sensitivity. • Context: Accurate estimates of forest seed production are central for a wide range of ecological studies. As reference methods such as litter traps (LT) are cost- and time-consuming, there is a need of fast, reliable, and low-cost tools to quantify this variable in the field. • Aims: To test two indirect methods, which consist of counting the seeds fallen in quadrats. • Methods: The trial was performed in three broadleaved (beech, chestnut, and Turkey oak) tree species. Seeds are either manually counted in quadrats placed at the ground (GQ) or from images acquired in the same quadrats (IQ) and then compared against LT measurements. • Results: GQ and IQ provide fast and reliable estimates of seeds in both oak and chestnut. In particular, IQ is robust in terms of user sensitivity and potentially enables automation in the process of seed monitoring. A null-mast year in beech hindered validation of quadrats in beech. • Conclusion: Quadrat counting is a powerful tool to estimate forest seed production. We recommend using quadrats and LT to cross-calibrate the two methods in case of estimating seed biomass. Quadrats could then be used more routinely on account of their faster and simpler procedure to obtain measurements at more spatially extensive scales. © 2021, The Author(s).
Characterizing the climatic niche of mast seeding in beech: Evidences of trade-offs between vegetation growth and seed production
Bajocco
,
Sofia
,
Ferrara
,
Carlotta
,
Bascietto
,
Marco
,
Alivernini
,
Alessandro
,
Chirichella
,
Roberta
,
Cutini
,
Andrea
,
Chianucci
,
Francesco
Mostra abstract
Masting is a complex mechanism which is mainly driven by a combination of internal plant resources and climatic conditions. While the driving role of climate in masting is being intensively studied, the interplay among climate, seed production, vegetation growth and phenology still needs further investigation. The objectives of this study were to identify the climatic determinants of different levels of seed production and of NDVI-based vegetation growth and phenology in European beech, and to evaluate if exists a trade-off between these two plant processes. To answer these questions, we used a 25-year-long dataset of beech seed production. We exploited the concept of ecological niche assuming that a mast year can be modeled like a species with variable preferences for different resources, which are the underlying annual climatic conditions; we performed an Ecological Niche Factor Analysis (ENFA), a presence-only modeling tool conventionally used in zoology and botany, and used seasonal (spring, summer, autumn) Standardized Precipitation-Evaporation Index (SPEI) observations, considering the current year (y−0), and up to one (y−1) and two (y−2) years before the masting event. For analyzing the role of vegetation growth and phenology, we used seasonal Normalized Difference Vegetation Index (NDVI) values and associated NDVI-based phenological metrics derived from Landsat imagery. Results indicated the driving role of climate for masting, especially in VHSP years. A moist summer and dry spring at y−2 and a dry summer at y−1 represented the main driving climatic conditions for masting; while a moist spring during the observation year represented the key condition for triggering higher intensities of seed production. Summer NDVI at y−0 and y−1 represented the variables discriminating best between masting and non-masting years and resulted as driven by opposite summer climatic conditions than seed production, thus indicating a trade-off between seed production and vegetation phenology. We concluded that reproduction and vegetation growth act as two different climate-dependent plant responses in beech, in a way that certain conditions through the years promote mast seeding and the opposite conditions favor vegetation growth. The understanding of climate-growth-masting relationships represents indispensable knowledge for providing a holistic view of masting mechanisms and developing adaptive forest management strategies in this species. © 2020
Development of digital photographic approaches to assess leaf traits in broadleaf tree species
Mostra abstract
Plants display a large number of traits which are reflected in physiological and ecological functions (functional traits). Leaf traits are amongst the most important functional traits. However, a great challenge in measuring leaf traits in the field is that direct methods are limited by the cost of the instruments and the time and work required by direct measurements, which are often destructive. As an alternative, we developed and tested a non-destructive methodology to assess a suite of leaf traits using different digital photographic approaches, with the intimate aim to develop a rapid, robust and cheap protocol for leaf trait measurements in the field. The proposed digital photographic approaches were tested in broadleaved tree species Digital photography allowed to assess a morphological foliar trait (leaf area; LA) and physiological foliar traits (leaf reflectance in red (R), green (G) and blue (B) bands; leaf venation attributes). Leaf area derived from photography significantly agreed with that directly measured with a leaf area meter (LA<inf>PHOTO</inf> = 0.98 LA<inf>AREA METER</inf> + 0.84, R<sup>2</sup> = 0.99, p < 0.001); leaf reflectance in the R, G, B channels derived from photography significantly agreed with that directly measured with a field spectroradiometer (SPEC) (R<inf>PHOTO</inf> = 0.77 R<inf>SPEC</inf> + 0.05, R<sup>2</sup> = 0.61, p < 0.001; G<inf>PHOTO</inf> = 0.79 G<inf>SPEC</inf> + 0.06, R<sup>2</sup> = 0.58, p < 0.001; B<inf>PHOTO</inf> = 0.56 B<inf>SPEC</inf> + 0.00, R<sup>2</sup> = 0.51, p < 0.001). Leaf venation traits estimated from photography agreed to within ±20% measurements obtained in cleared leaves of the same species. Based on the obtained results, we demonstrated that digital photography can be an effective tool to obtain a fast, cheap, reliable and non-destructive assessment of morphological and physiological leaf traits in broadleaf tree species, being highly suitable for use in long-term research and monitoring programs. © 2019 Elsevier Ltd
Multi-temporal dataset of stand and canopy structural data in temperate and Mediterranean coppice forests
Chianucci
,
Francesco
,
Ferrara
,
Carlotta
,
Bertini
,
Giada
,
Fabbio
,
Gianfranco
,
Tattoni
,
Clara
,
Rocchini
,
Duccio
,
Corona
,
P.
,
Cutini
,
Andrea
Mostra abstract
Key message: We provided long-term stand and canopy structural data from permanent monitoring plots representative of some most diffuse temperate and Mediterranean forests, under different coppice management regimes. Periodic inventories were performed in the surveyed plots since the 1970s. Annual litterfall production and its partitioning (leaf, woody, reproductive parts) and optical canopy measurements using the LAI-2000 Plant Canopy Analyzer were performed every year in fully equipped plots since the 1990s. These data can be used for evaluating the influence of coppice management in the stand and canopy structure, the parametrization of radiative transfer models that require accurate ground truth data, and the calibration of high to medium resolution remotely sensed data. Dataset access is at https://doi.org/10.17632/z8zm3ytkcx.2. Associated metadata is available at https://agroenvgeo.data.inra.fr/geonetwork/srv/eng/catalog.search#/metadata/2bd2d77f-3cf8-43da-b1b5-9f8196dc017f . © 2019, INRA and Springer-Verlag France SAS, part of Springer Nature.
A new method to estimate clumping index integrating gap fraction averaging with the analysis of gap size distribution
leaf area index
hemispherical photography
canopy nonrandomness
ordered weighted averaging (owa) operator
orness
Mostra abstract
Estimates of clumping index (Ω) are required to improve the indirect estimation of leaf area index (L) from optical field-based instruments such as digital hemispherical photography (DHP). A widely used method allows estimation of Ω from DHP using simple gap fraction averaging formulas (LX). This method is simple and effective but has the disadvantage of being sensitive to the spatial scale (i.e., the azimuth segment size in DHP) used for averaging and canopy density. In this study, we propose a new method to estimate Ω (LXG) based on ordered weighted gap fraction averaging (OWA) formulas, which addresses the disadvantages of LX and also accounts for gap size distribution. The new method was tested in 11 broadleaved forest stands in Italy; Ω estimated from LXG was compared with other commonly used clumping correction methods (LX, CC, and CLX). Results showed that LXG yielded more accurate Ω estimates, which were also more correlated with the values obtained from the gap size distribution methods (CC and CLX) than Ω obtained from LX. Leaf area index estimates, adjusted by LXG, are only 5%–6% lower than direct measurements obtained from litter traps, while other commonly used clumping correction methods yielded more underestimation. © 2019, Canadian Science Publishing. All rights reserved.
Sustainable land-use, wildfires, and evolving local contexts in a Mediterranean Country, 2000-2015
Marchi
,
Maurizio
,
Chianucci
,
Francesco
,
Ferrara
,
Carlotta
,
Pontuale
,
Giorgio
,
Pontuale
,
Elisa
,
Mavrakis
,
Anastasios F.
,
Morrow
,
Nathan
,
Rossi
,
Fabrizio
,
Salvati
,
Luca
Mostra abstract
Socioeconomic conditions and land management choices combine to affect changes in long-term wildfire regimes in Mediterranean-type ecosystems. Identification of specific drivers and dynamics at the local level is needed to inform land resource planning and to enhance wildfire management efficiency. Therefore, investigating feedback relationships between wildfire and socioeconomic conditions at local and regional scales can reveal consistency in spatial and temporal patterns influencing wildfire frequency, intensity, and severity. This study assessed long-term wildfire characteristics in Greece-one of the most fire-prone countries in Europe-over two consecutive time periods characterized by economic expansion (2000-2007) and recession (2008- 2015). An integrated, multivariate statistical approach was implemented to assess the latent relationship between socioeconomic forces and localized wildfire regime indicators. Changes in the number of fires at the wildland-urban interface and duration of wildfires were consistent with expectations. Observed changes in the size of fires showed mixed results. Empirical findings of this study indicate analysis of wildfire regimes that takes into account both the socioeconomic and environmental factors in the overall territorial context of Mediterranean-type ecosystems, at both regional and local scale, may prove informative for the design of wildfire prevention measures in Greece. © 2018 by the authors.
A dataset of leaf inclination angles for temperate and boreal broadleaf woody species
Chianucci
,
Francesco
,
Písek
,
Jan
,
Raabe
,
Kairi
,
Marchino
,
Luca
,
Ferrara
,
Carlotta
,
Corona
,
P.
An objective image analysis method for estimation of canopy attributes from digital cover photography
Mostra abstract
Key message: A method was proposed to remove the subjectivity of gap size analyses approaches implemented by default in cover photography. The method yielded robust and replicable measurements of forest canopy attributes. Abstract: Digital cover photography (DCP) is an increasingly popular method to estimate canopy attributes of forest canopies. Compared with other canopy photographic methods, DCP is fast, simple, and less sensitive to image acquisition and processing. However, the image processing steps used by default in DCP have a large substantial subjective component, particularly regarding the separation of canopy gaps into large gaps and small gaps. In this study, we proposed an objective procedure to analyse DCP based on the statistical distribution of gaps occurring in any image. The new method was tested in 11 deciduous forest stands in central Italy, with different tree composition, stand density, and structure, which is representative of the natural variation of these forest types. Results indicated that the new method removed the subjectivity of manual and semi-automated gap size classifications performed so far in cover photography. A comparison with direct LAI measurements demonstrated that the new method outperformed the previous approaches and increased the precision of LAI estimates. Results have important implications in forestry, because the simplicity of the method allowed objective, reliable, and highly reproducible estimates of canopy attributes, which are largely suitable in forest monitoring, where measures are routinely repeated. In addition, the use of a restricted field of view enables implementation of this photographic method in many devices, including smartphones, downward-looking cameras, and unmanned aerial vehicles. © 2018, Springer-Verlag GmbH Germany, part of Springer Nature.
A Multidimensional Statistical Framework to Explore Seasonal Profile, Severity and Land-Use Preferences of Wildfires in a Mediterranean Country
Salvati
,
Luca
,
Ferrara
,
Agostino Maria Silvio
,
Mancino
,
Giuseppe
,
Kelly
,
Claire L.
,
Chianucci
,
Francesco
,
Corona
,
P.
Mostra abstract
This study analyses spatio-temporal patterns of wildfires in Greece using a multidimensional statistical framework based on non-parametric correlations, principal component analysis, clustering and stepwise discriminant analysis. Specifically, we assess the frequency, seasonal profile, severity and land-use type of 135 178 wildfires which occurred between 2000-2012 in Greece, one of the countries most affected by fire in Europe. Our results show that both the number of fires and the average size of the area covered by fire show a specific seasonal pattern with a marked increase during the dry season. Principal component analysis identifies three dimensions linked with the main type of land-use affected by the fires: (i) medium and large fires primarily affected landscapes composed of forests, mixed woodlands/shrublands and croplands; (ii) small fires mainly affected fragmented landscapes, i.e. those with mosaics of different crops, market gardens and non-vegetated, abandoned or marginal areas; (iii) fires affecting wetlands and pastures occurred particularly in late summer and showing medium-low severity. Hierarchical clustering highlights similarities in spatio-temporal patterns between fire indicators (ignition date, burnt land cover classes, fire size, fire density). K-means clustering allows us to distinguish between low-severity fires occurring in the wet season from intense and frequent fires occurring in the dry season but with distinct land-use selectivity. The research reported here contributes insight into the complexity of wild fires in the Mediterranean region and supports the design of more effective fire prevention measures including sustainable forest management practices and careful regional planning to minimise risk factors.