Loading...
Pubblicazioni Scientifiche
Filtri di ricerca 4 risultati
Pubblicazioni per anno
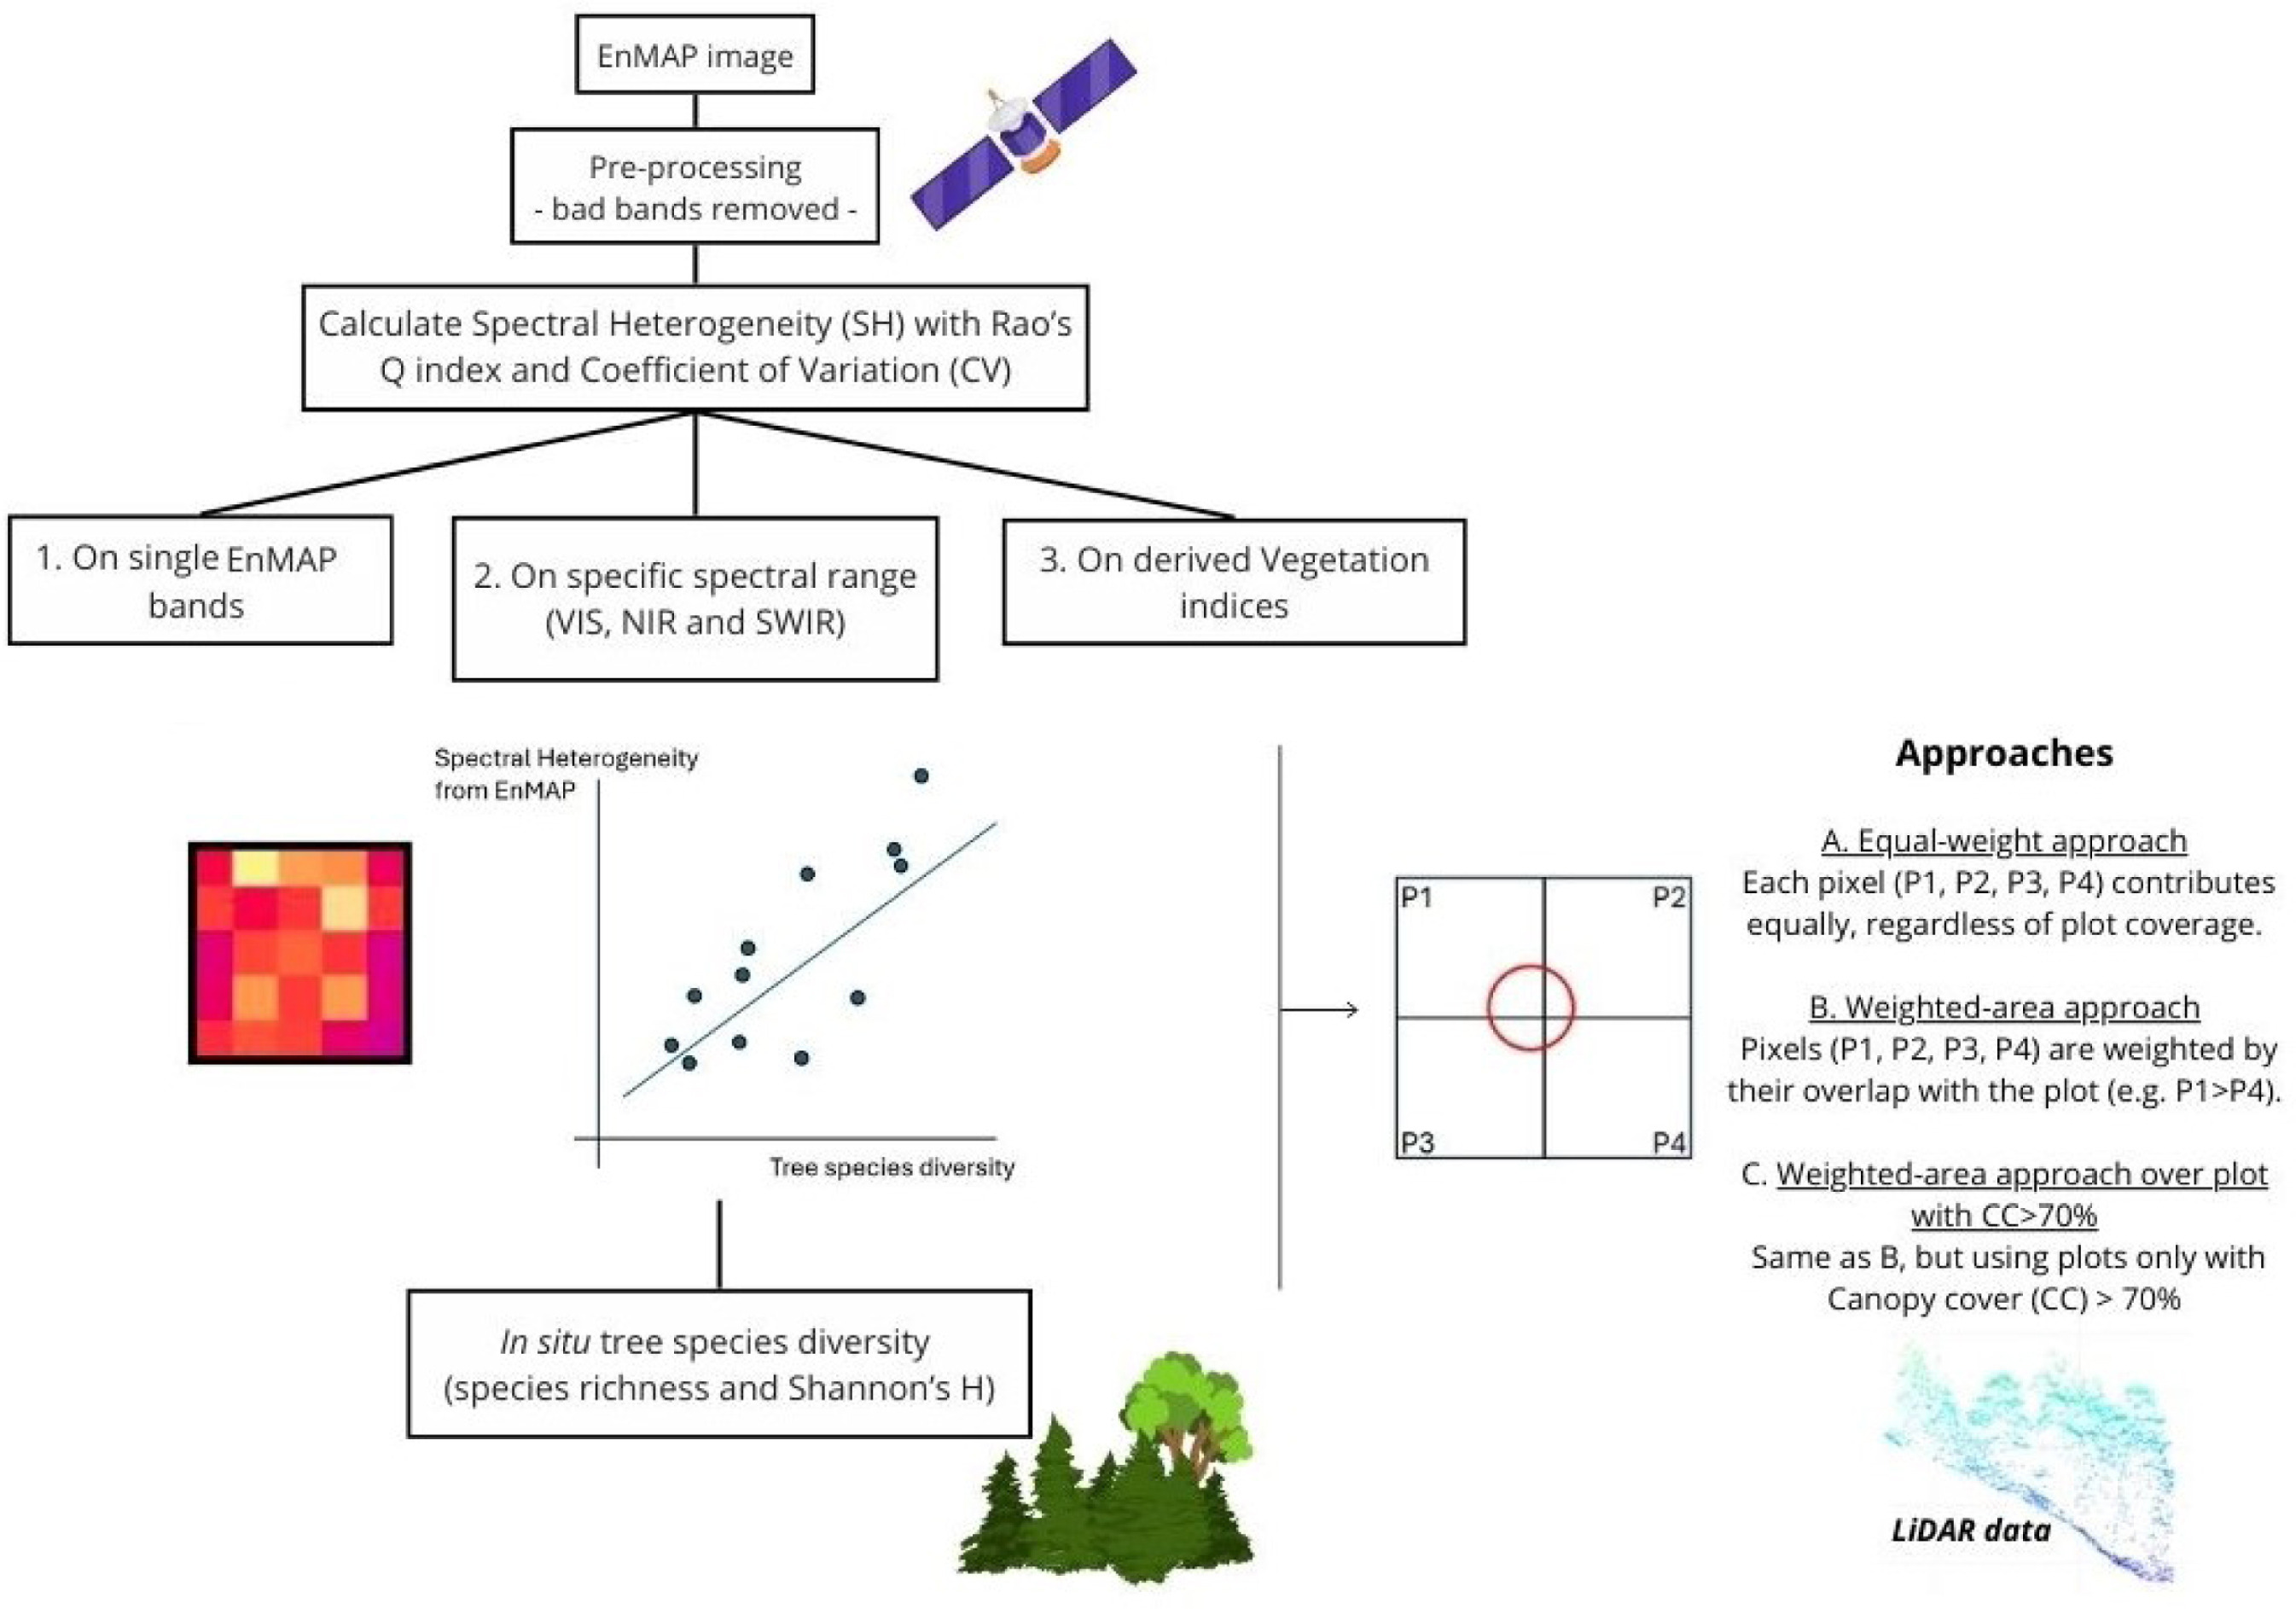
Spectral heterogeneity from the spaceborne imaging spectrometer EnMAP reveals biodiversity patterns in forest ecosystems
Torresani
,
Michele
,
Rossi
,
Christian
,
Mina
,
Marco
,
Menegaldo
,
Irene
,
Cappuccio
,
Matteo
,
Perrone
,
Michela
,
Hakkenberg
,
Christopher R.
,
Rocchini
,
Duccio
,
Puletti
,
Nicola
,
Stendardi
,
Laura
,
Montagnani
,
Leonardo
,
Tognetti
,
Roberto
Mostra abstract
The Spectral Variation Hypothesis (SVH) proposes that spectral heterogeneity (SH), derived from optical data, can serve as a proxy for estimating biodiversity. In this study, we tested the SVH across 42 forest plots in the Italian Alps using imaging spectroscopy data from the EnMAP satellite. We investigated the relationship between SH—quantified using two different metrics, Rao's Q and the coefficient of variation (CV)—and tree species diversity (using Shannon's H index and species richness). We applied three levels of spectral analysis: (1) SH calculated for each individual EnMAP band; (2) SH aggregated across broader spectral ranges (Visible -VIS-, Near Infrared -NIR-, and Shortwave Infrared -SWIR-) and (3) SH derived from vegetation indices (VIs). These analyses were performed under three spatial approaches: (A) a normal approach assigning equal weight to all four EnMAP pixels intersecting a plot; (B) a weighted approach based on the proportional overlap of each pixel with the plot area; and (C) a weighted canopy cover (CC)>70% approach, which included only plots with CC greater than 70% as derived from airborne laser scanning (ALS) LiDAR data. Weak to moderate correlations were observed when SH was derived from single bands, with the strongest relationships in the NIR (R<sup>2</sup> approaching 0.4), followed by the VIS and SWIR regions. A similar trend emerged when SH was aggregated across broader spectral ranges, with the highest correlations again found in the NIR (R<sup>2</sup> up to 0.35). In contrast, lower R<sup>2</sup> values were obtained when SH was computed from specific VIs. The weighted approaches, especially when restricted to plots with CC >70%, consistently yielded higher R<sup>2</sup> values than the equal-weight approach in all three the spectral analysis. Results were consistent across both SH metrics (Rao's Q and CV), with stronger correlations when species richness was used as the biodiversity metric. This work highlights how EnMAP hyperspectral data, despite inherent constraints, can provide valuable insights into forest biodiversity monitoring. © 2025 The Author(s)

A plot-level exploratory analysis of European forest based on the results from the BioSoil Forest Biodiversity project
Galluzzi
,
Marta
,
Giannetti
,
Francesca
,
Puletti
,
Nicola
,
Canullo
,
R.
,
Rocchini
,
Duccio
,
Bastrup-Birk
,
Annemarie M.
,
Chirici
,
Gherardo
Mostra abstract
The lack of multi-dimensional data is one of the major gaps which limit the knowledge and the assessment possibilities of European forests. Nowadays, the most extensive and complete data on the European forest statuses are given by National Forest Inventories (NFIs) which provide information about the extent of forest’s resources and their composition and structure. Traditionally, NFIs collect data related to trees, with a limited consideration of other habitat components, such as ground vegetation. This information which goes beyond the mere arboreal component is instead essential for a more complete forest biodiversity assessment. This paper is aimed at introducing the ICP Forests LI-BioDiv database which resulted from BioSoil Forest Biodiversity, a large collaborative European project. This database is organized as a multi-dimensional forest geodatabase that contains forest structure and vegetation records collected in 19 European countries in the period of 2005–2008. The data were acquired from 3311 geocoded plots where several different types of data were gathered: stand-level general information, tree-level data, deadwood, canopy closure and floristic composition. This paper is structured in order to: (1) give a clear overview of the raw data available in the database and to (2) present an elaboration of raw data to calculate simple plot-level forest variables (biomass, deadwood volume, alpha diversity). On the basis of the results we achieved, the LI-BioDiv database appears useful mainly for research purposes aimed at studying cross-relationships between multiple forest variables and not for an operative use for monitoring and assessing European forest. In particular, we hope that this contribution can stimulate scientists to carry out cross-analysis of the database for defining future forest biodiversity indicators that could be introduced into the field protocols of the NFIs in Europe. © 2019, Springer-Verlag GmbH Germany, part of Springer Nature.
Multi-temporal dataset of stand and canopy structural data in temperate and Mediterranean coppice forests
Chianucci
,
Francesco
,
Ferrara
,
Carlotta
,
Bertini
,
Giada
,
Fabbio
,
Gianfranco
,
Tattoni
,
Clara
,
Rocchini
,
Duccio
,
Corona
,
P.
,
Cutini
,
Andrea
Mostra abstract
Key message: We provided long-term stand and canopy structural data from permanent monitoring plots representative of some most diffuse temperate and Mediterranean forests, under different coppice management regimes. Periodic inventories were performed in the surveyed plots since the 1970s. Annual litterfall production and its partitioning (leaf, woody, reproductive parts) and optical canopy measurements using the LAI-2000 Plant Canopy Analyzer were performed every year in fully equipped plots since the 1990s. These data can be used for evaluating the influence of coppice management in the stand and canopy structure, the parametrization of radiative transfer models that require accurate ground truth data, and the calibration of high to medium resolution remotely sensed data. Dataset access is at https://doi.org/10.17632/z8zm3ytkcx.2. Associated metadata is available at https://agroenvgeo.data.inra.fr/geonetwork/srv/eng/catalog.search#/metadata/2bd2d77f-3cf8-43da-b1b5-9f8196dc017f . © 2019, INRA and Springer-Verlag France SAS, part of Springer Nature.
LONG-TERM COMPARISON OF IN SITU AND REMOTELY-SENSED LEAF AREA INDEX IN TEMPERATE AND MEDITERRANEAN BROADLEAVED FORESTS
Tattoni
,
Clara
,
Chianucci
,
Francesco
,
Grotti
,
Mirko
,
Zorer
,
Roberto
,
Cutini
,
Andrea
,
Rocchini
,
Duccio
Mostra abstract
Monitoring vegetation structure and functioning is critical for modelling terrestrial ecosystems and energy cycles. Leaf area index (LAI) is an important structural property of vegetation used in many land-surface, climate, and forest monitoring applications. Remote sensing provides a unique way to obtain estimates of leaf area index at spatially extensive areas. However, the analysis and extraction of quantitative information from remotely-sensed data require accurate cross-calibration with in situ forest measurements, which are generally spatially-and temporally-limited, thereby limiting the ability to compare the seasonal dynamic patterns between field and remotely-sensed time series. This is particularly relevant in temperate broadleaved forests, which are characterized by high level of complexity, which can complicate the retrieval of vegetation attributes from remotely-sensed data. In this study, we performed a long-term comparison of MODIS LAI products with continuous in situ leaf area index measurements collected monthly in temperate and Mediterranean forests from 2000 to 2016. Results indicated that LAI showed a good correlation between satellite and ground data for most of the stands, and the pattern in seasonal changes were highly overlapping between the time-series. We conclude that MODIS LAI data are suitable for phenological application and for up-scaling LAI from the stand level to larger scales. © 2019, Italian Society of Remote Sensing. All rights reserved.