Loading...
Pubblicazioni Scientifiche
Filtri di ricerca 2 risultati
Pubblicazioni per anno
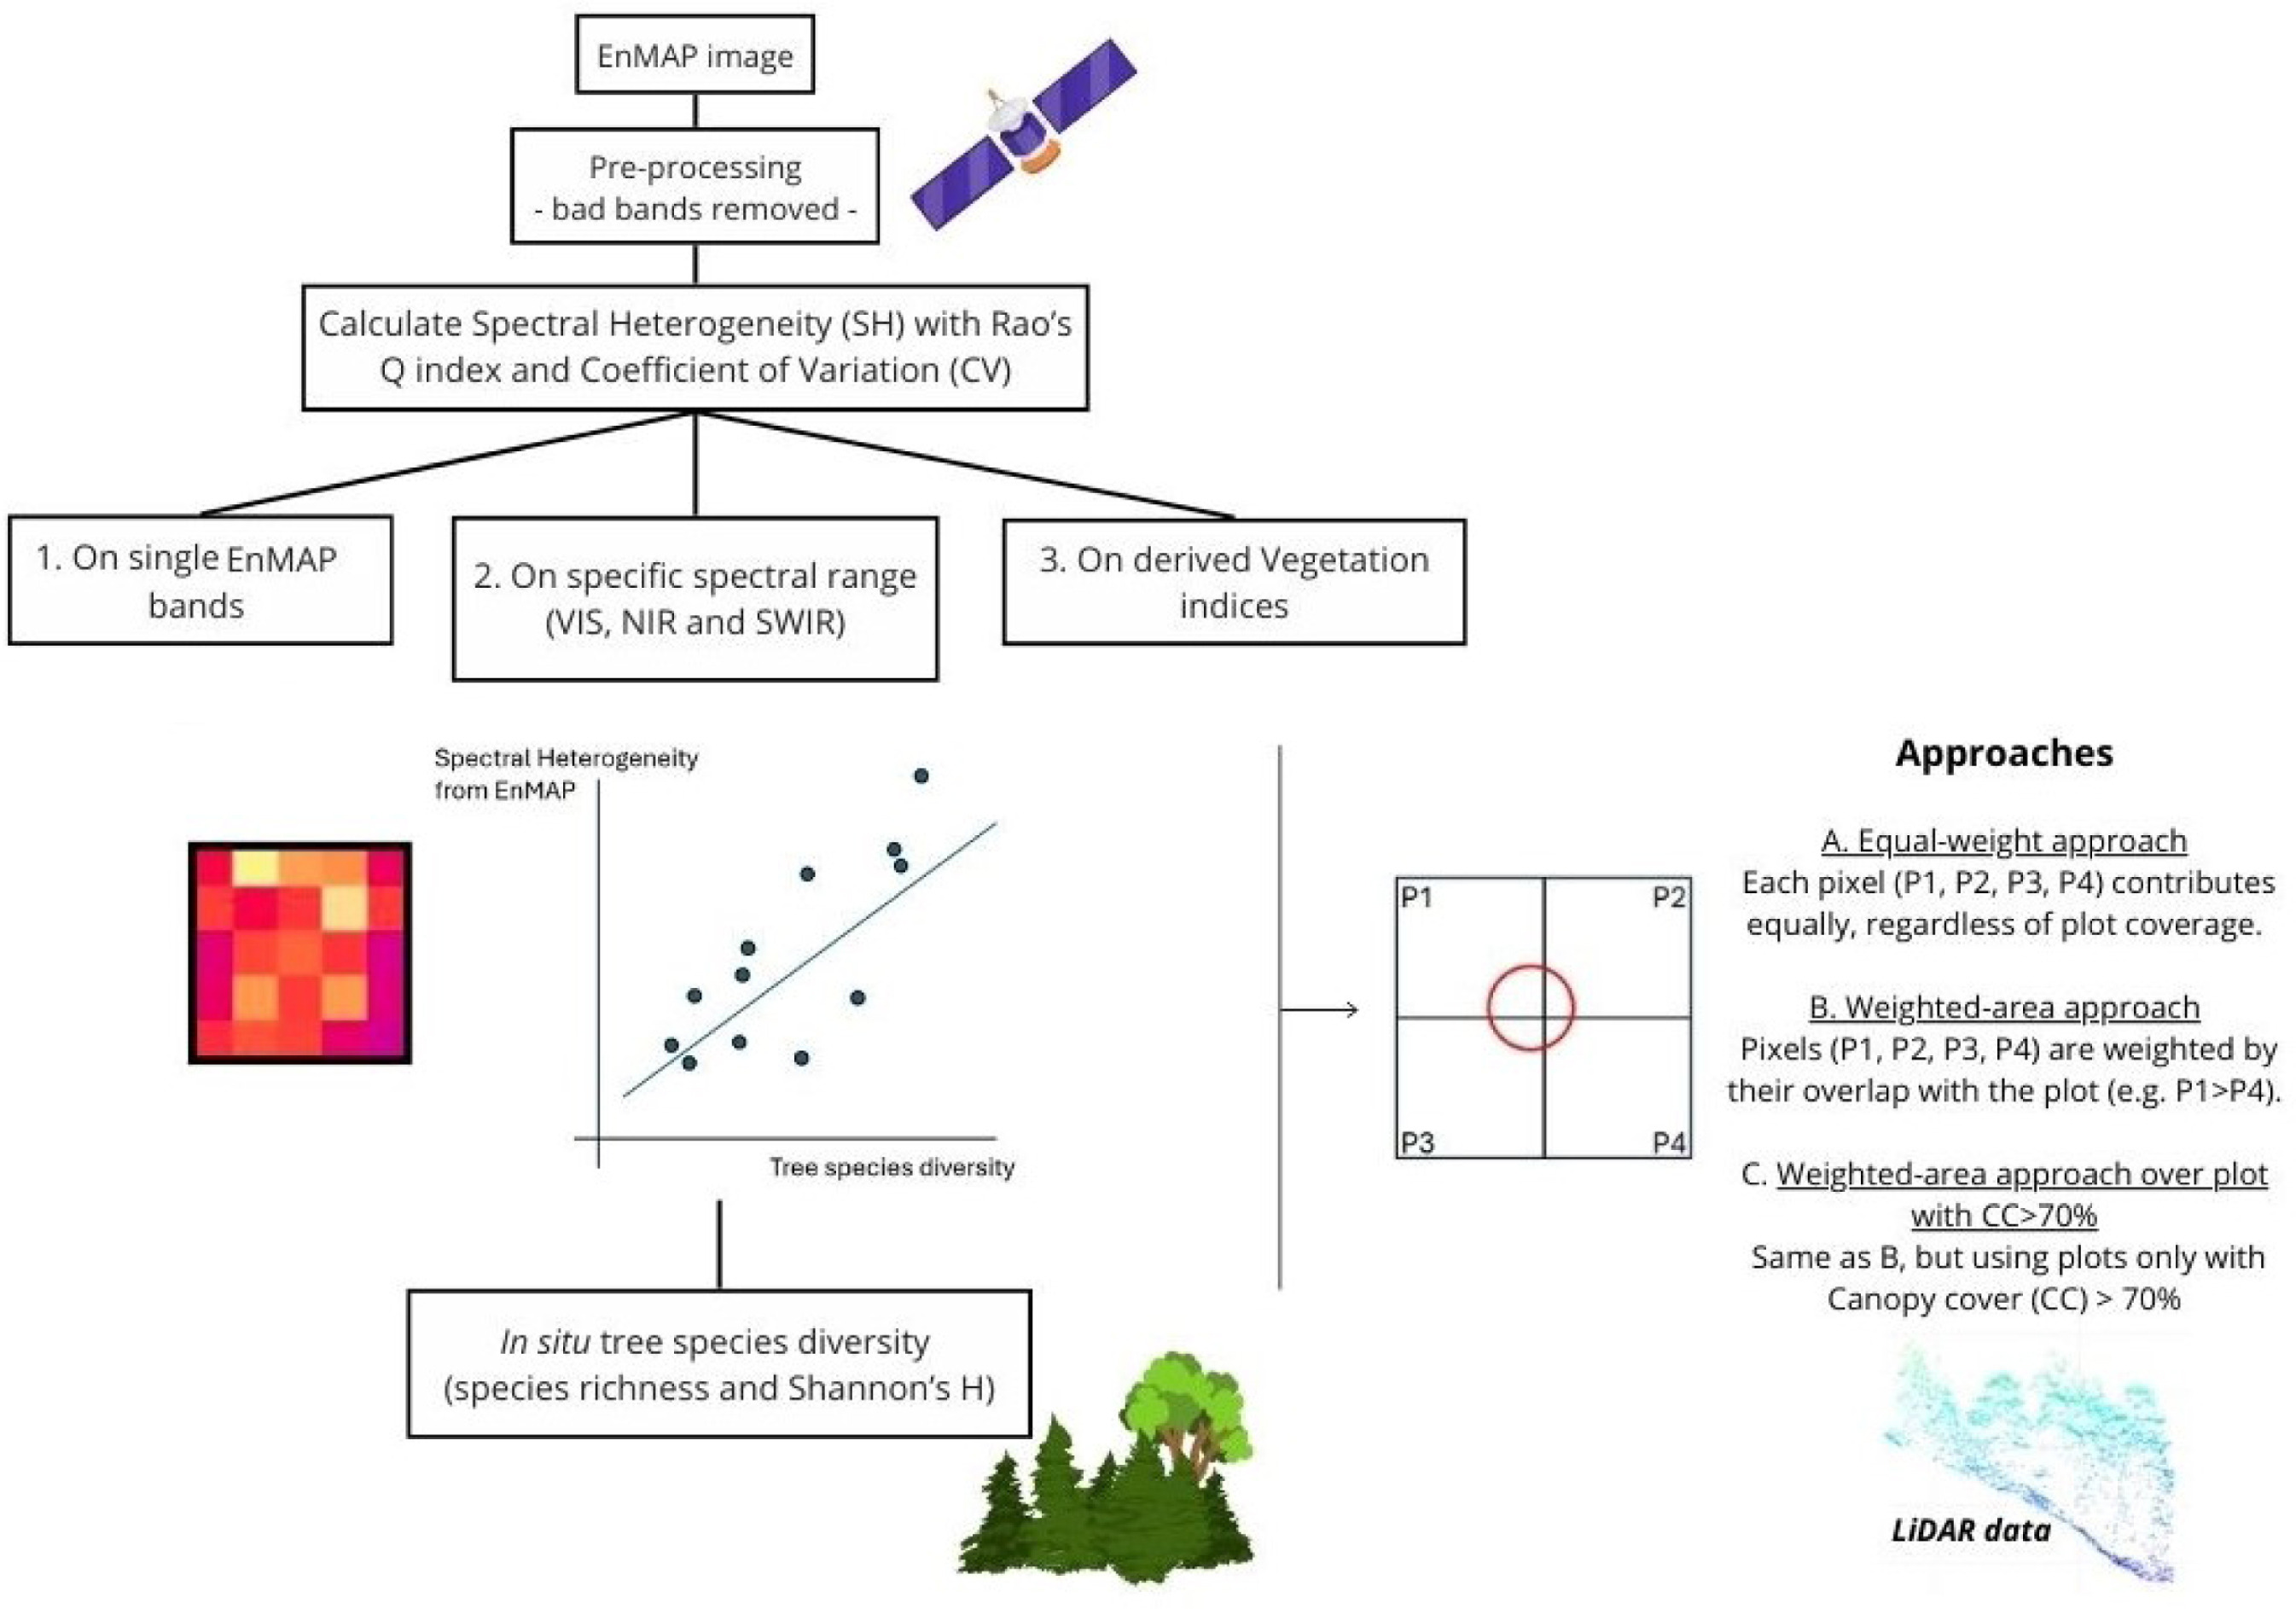
Spectral heterogeneity from the spaceborne imaging spectrometer EnMAP reveals biodiversity patterns in forest ecosystems
Torresani
,
Michele
,
Rossi
,
Christian
,
Mina
,
Marco
,
Menegaldo
,
Irene
,
Cappuccio
,
Matteo
,
Perrone
,
Michela
,
Hakkenberg
,
Christopher R.
,
Rocchini
,
Duccio
,
Puletti
,
Nicola
,
Stendardi
,
Laura
,
Montagnani
,
Leonardo
,
Tognetti
,
Roberto
Mostra abstract
The Spectral Variation Hypothesis (SVH) proposes that spectral heterogeneity (SH), derived from optical data, can serve as a proxy for estimating biodiversity. In this study, we tested the SVH across 42 forest plots in the Italian Alps using imaging spectroscopy data from the EnMAP satellite. We investigated the relationship between SH—quantified using two different metrics, Rao's Q and the coefficient of variation (CV)—and tree species diversity (using Shannon's H index and species richness). We applied three levels of spectral analysis: (1) SH calculated for each individual EnMAP band; (2) SH aggregated across broader spectral ranges (Visible -VIS-, Near Infrared -NIR-, and Shortwave Infrared -SWIR-) and (3) SH derived from vegetation indices (VIs). These analyses were performed under three spatial approaches: (A) a normal approach assigning equal weight to all four EnMAP pixels intersecting a plot; (B) a weighted approach based on the proportional overlap of each pixel with the plot area; and (C) a weighted canopy cover (CC)>70% approach, which included only plots with CC greater than 70% as derived from airborne laser scanning (ALS) LiDAR data. Weak to moderate correlations were observed when SH was derived from single bands, with the strongest relationships in the NIR (R<sup>2</sup> approaching 0.4), followed by the VIS and SWIR regions. A similar trend emerged when SH was aggregated across broader spectral ranges, with the highest correlations again found in the NIR (R<sup>2</sup> up to 0.35). In contrast, lower R<sup>2</sup> values were obtained when SH was computed from specific VIs. The weighted approaches, especially when restricted to plots with CC >70%, consistently yielded higher R<sup>2</sup> values than the equal-weight approach in all three the spectral analysis. Results were consistent across both SH metrics (Rao's Q and CV), with stronger correlations when species richness was used as the biodiversity metric. This work highlights how EnMAP hyperspectral data, despite inherent constraints, can provide valuable insights into forest biodiversity monitoring. © 2025 The Author(s)

Linking Acoustic Indices to Vegetation and Microclimate in a Historical Urban Garden: Setting the Stage for a Restorative Soundscape
Portaccio
,
Alessia
,
Chianucci
,
Francesco
,
Pirotti
,
Francesco
,
Piragnolo
,
Marco
,
Sozzi
,
Marco
,
Zangrossi
,
Andrea
,
Celli
,
Miriam
,
Mazzella Di Bosco
,
Marta
,
Bolognesi
,
Monica
,
Sella
,
Enrico
,
Corbetta
,
Maurizio
,
Pazzaglia
,
Francesca
,
Cavalli
,
R.
Mostra abstract
Urban soundscapes are increasingly recognized as fundamental for both ecological integrity and human well-being, yet the complex interplay between the vegetation structure, seasonal dynamics, and microclimatic factors in shaping these soundscapes remains poorly understood. This study tests the hypothesis that vegetation structure and seasonally driven biological activity mediate the balance and the quality of the urban acoustic environment. We investigated seasonal and spatial variations in five acoustic indices (NDSI, ACI, AEI, ADI, and BI) within a historical urban garden in Castelfranco Veneto, Italy. Using linear mixed-effects models, we analyzed the effects of season, microclimatic variables, and vegetation characteristics on soundscape composition. Non-parametric tests were used to assess spatial differences in vegetation metrics. Results revealed strong seasonal patterns, with spring showing increased NDSI (+0.17), ADI (+0.22), and BI (+1.15) values relative to winter, likely reflecting bird breeding phenology and enhanced biological productivity. Among microclimatic predictors, temperature (p < 0.001), humidity (p = 0.014), and solar radiation (p = 0.002) showed significant relationships with acoustic indices, confirming their influence on both animal behaviour and sound propagation. Spatial analyses showed significant differences in acoustic patterns across points (Kruskal–Wallis p < 0.01), with vegetation metrics such as tree density and evergreen proportion correlating with elevated biophonic activity. Although the canopy height model did not emerge as a significant predictor in the models, the observed spatial heterogeneity supports the role of vegetation in shaping urban sound environments. By integrating ecoacoustic indices, LiDAR-derived vegetation data, and microclimatic parameters, this study offers novel insights into how vegetational components should be considered to manage urban green areas to support biodiversity and foster acoustically restorative environments, advancing the evidence base for sound-informed urban planning. © 2025 by the authors.