Loading...
Pubblicazioni Scientifiche
Filtri di ricerca 4 risultati
Pubblicazioni per anno
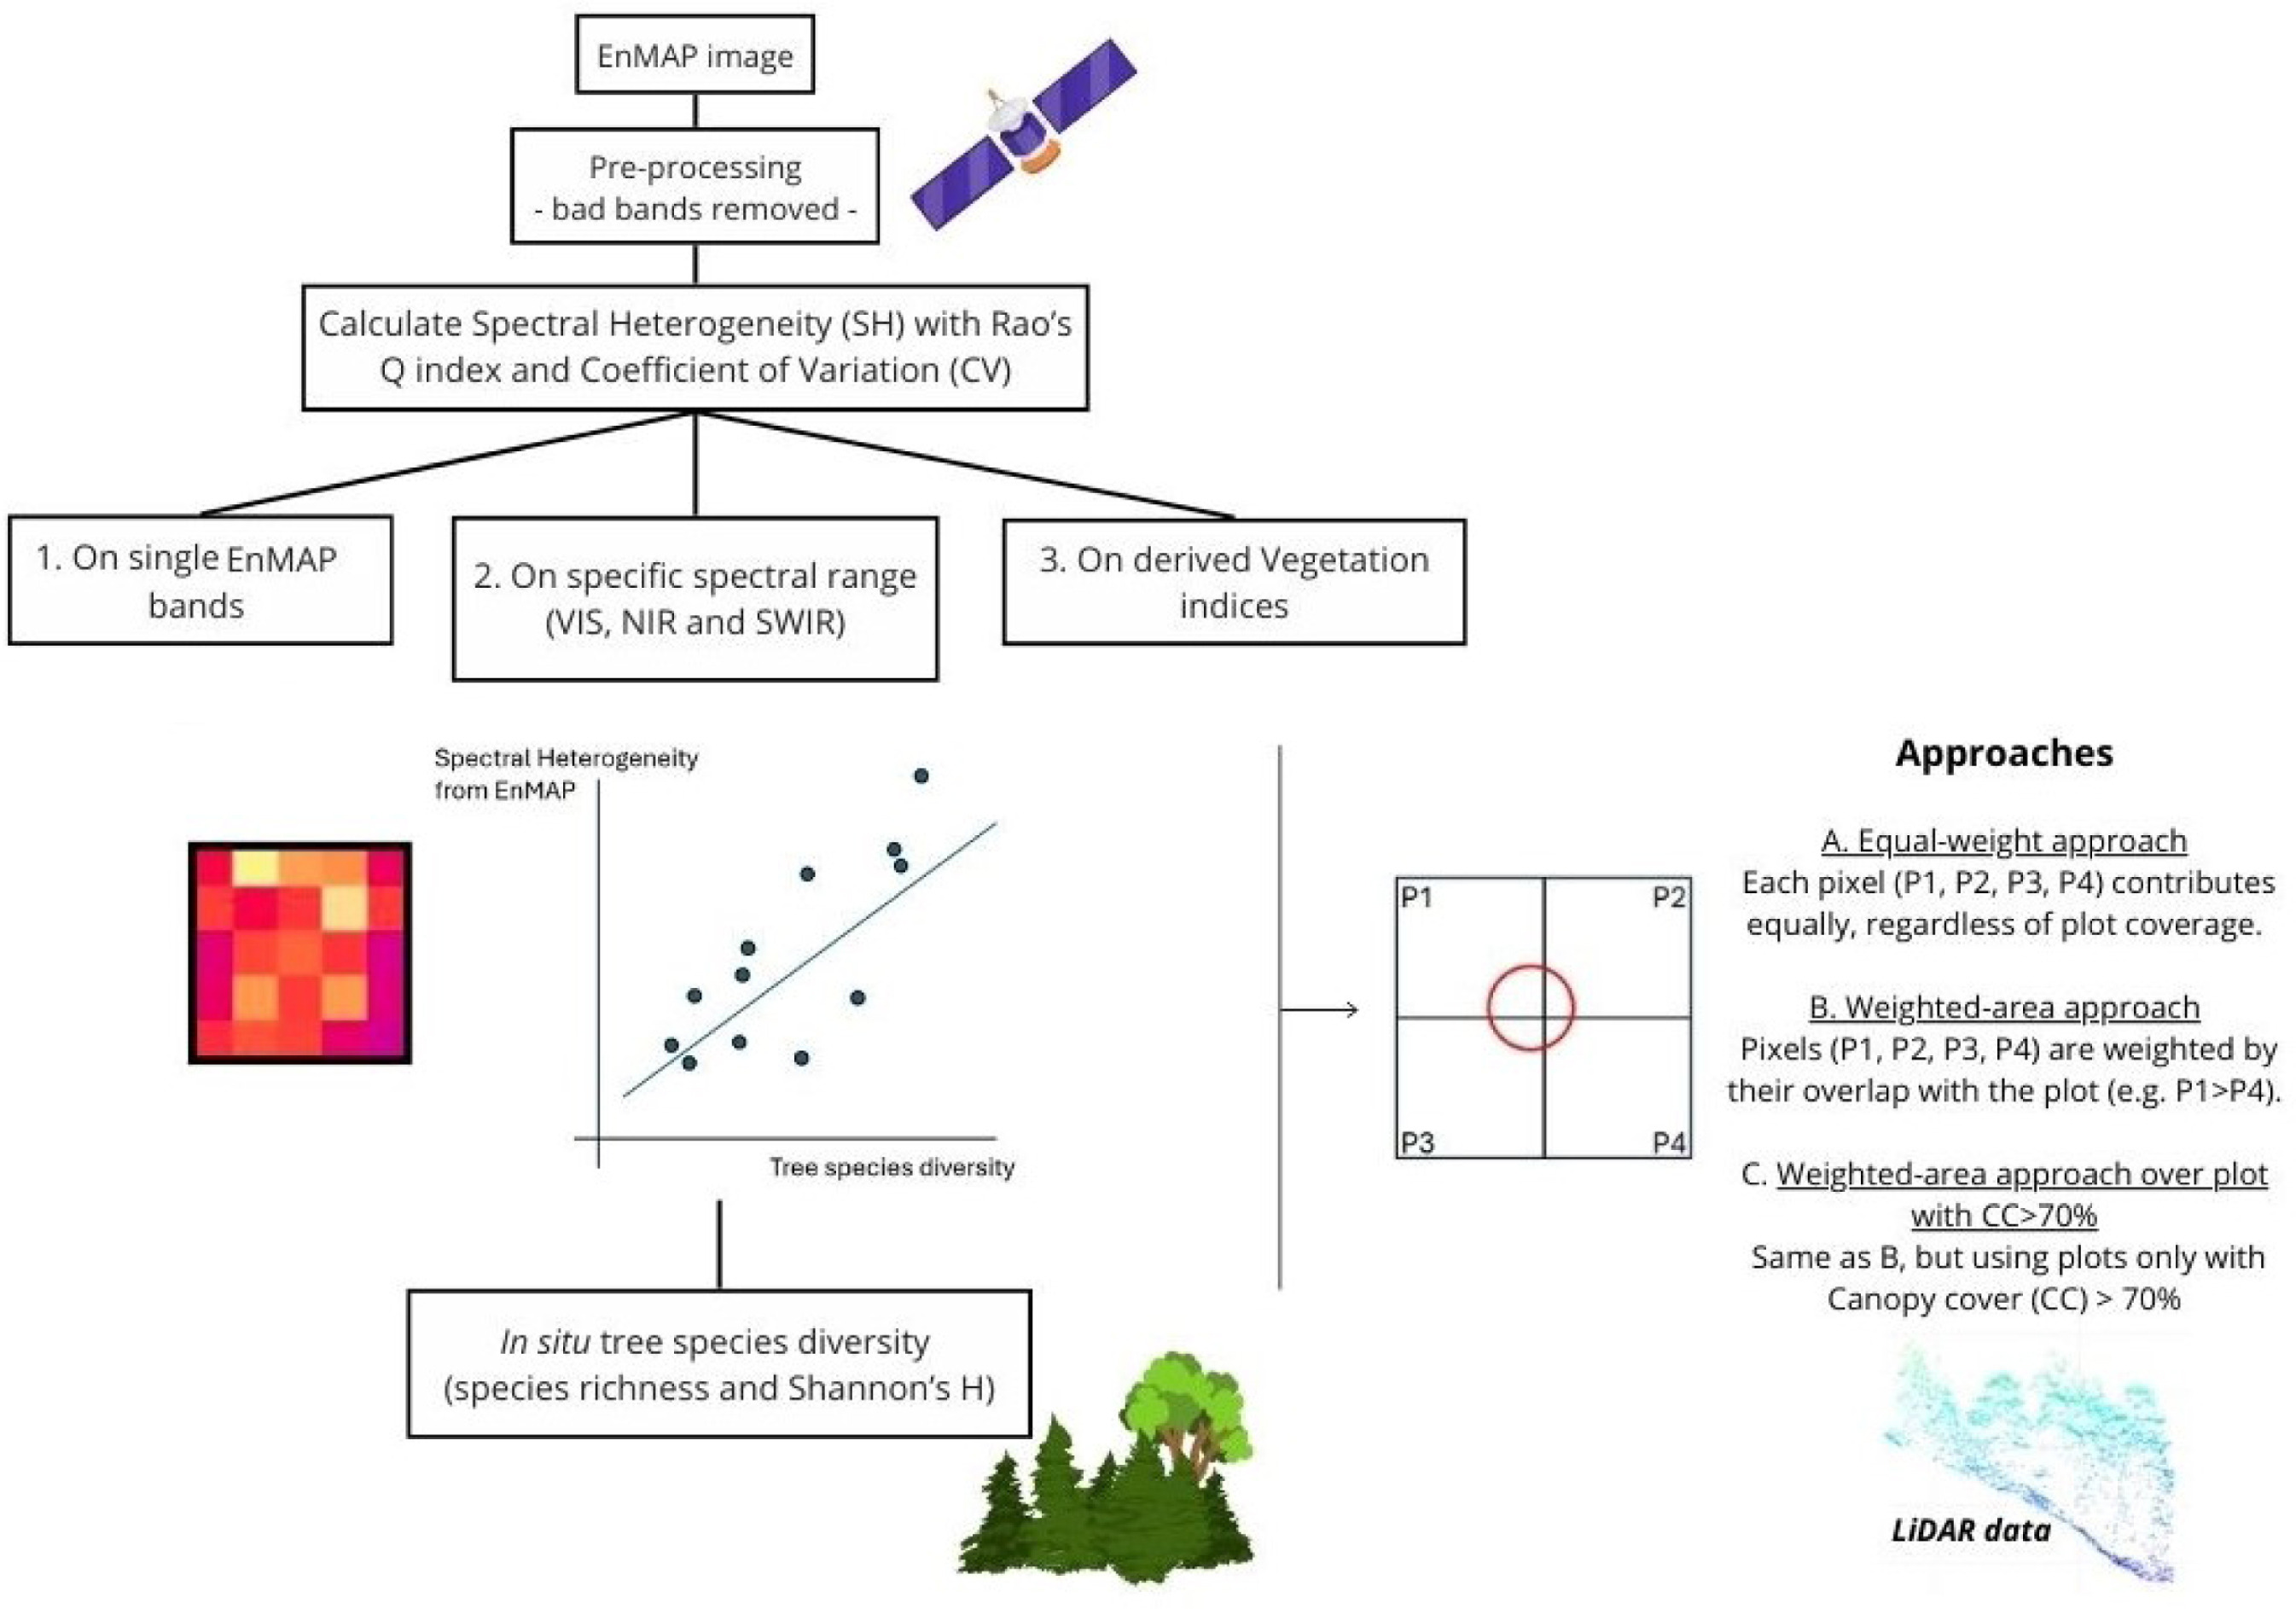
Spectral heterogeneity from the spaceborne imaging spectrometer EnMAP reveals biodiversity patterns in forest ecosystems
Torresani
,
Michele
,
Rossi
,
Christian
,
Mina
,
Marco
,
Menegaldo
,
Irene
,
Cappuccio
,
Matteo
,
Perrone
,
Michela
,
Hakkenberg
,
Christopher R.
,
Rocchini
,
Duccio
,
Puletti
,
Nicola
,
Stendardi
,
Laura
,
Montagnani
,
Leonardo
,
Tognetti
,
Roberto
Mostra abstract
The Spectral Variation Hypothesis (SVH) proposes that spectral heterogeneity (SH), derived from optical data, can serve as a proxy for estimating biodiversity. In this study, we tested the SVH across 42 forest plots in the Italian Alps using imaging spectroscopy data from the EnMAP satellite. We investigated the relationship between SH—quantified using two different metrics, Rao's Q and the coefficient of variation (CV)—and tree species diversity (using Shannon's H index and species richness). We applied three levels of spectral analysis: (1) SH calculated for each individual EnMAP band; (2) SH aggregated across broader spectral ranges (Visible -VIS-, Near Infrared -NIR-, and Shortwave Infrared -SWIR-) and (3) SH derived from vegetation indices (VIs). These analyses were performed under three spatial approaches: (A) a normal approach assigning equal weight to all four EnMAP pixels intersecting a plot; (B) a weighted approach based on the proportional overlap of each pixel with the plot area; and (C) a weighted canopy cover (CC)>70% approach, which included only plots with CC greater than 70% as derived from airborne laser scanning (ALS) LiDAR data. Weak to moderate correlations were observed when SH was derived from single bands, with the strongest relationships in the NIR (R<sup>2</sup> approaching 0.4), followed by the VIS and SWIR regions. A similar trend emerged when SH was aggregated across broader spectral ranges, with the highest correlations again found in the NIR (R<sup>2</sup> up to 0.35). In contrast, lower R<sup>2</sup> values were obtained when SH was computed from specific VIs. The weighted approaches, especially when restricted to plots with CC >70%, consistently yielded higher R<sup>2</sup> values than the equal-weight approach in all three the spectral analysis. Results were consistent across both SH metrics (Rao's Q and CV), with stronger correlations when species richness was used as the biodiversity metric. This work highlights how EnMAP hyperspectral data, despite inherent constraints, can provide valuable insights into forest biodiversity monitoring. © 2025 The Author(s)
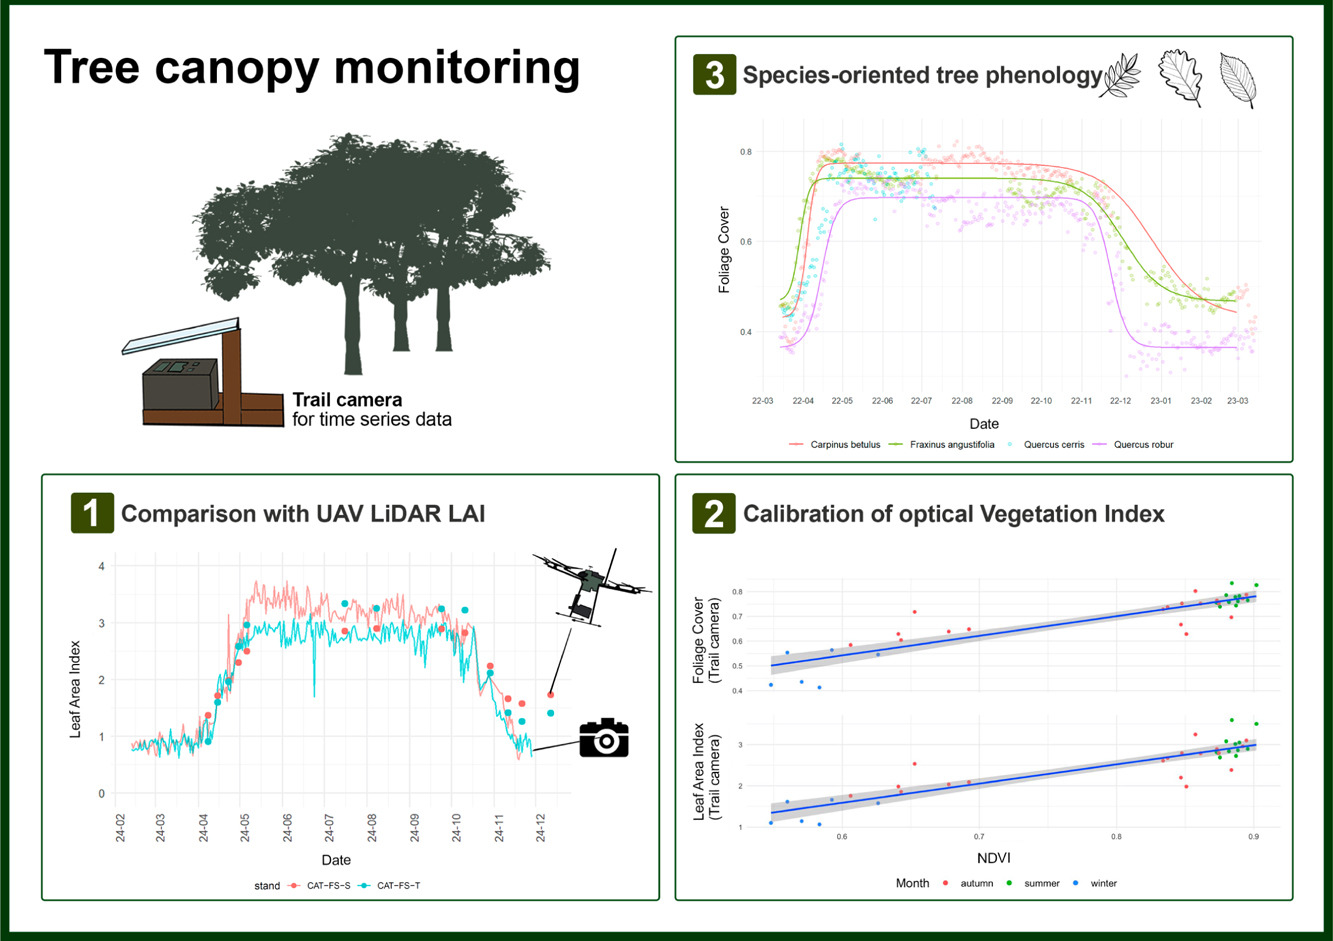
CrowNet: a trail-camera canopy monitoring system
Chianucci
,
Francesco
,
Lenzi
,
Alice
,
Minari
,
Emma
,
Guasti
,
Matteo
,
Gisondi
,
Silvia
,
Gonnelli
,
Marco
,
Innocenti
,
Simone
,
Ferrara
,
Carlotta
,
Campanaro
,
Alessandro
,
Ciampelli
,
Paola
,
Cutini
,
Andrea
,
Puletti
,
Nicola
Mostra abstract
Continuous monitoring of forest canopy structure and phenology is pivotal for the assessment of ecosystem responses to environmental variability and changes. The present study evaluated the use of repeat digital trail cameras as a low-cost, flexible, and accessible in situ monitoring solution for quantifying daily canopy attributes, including effective leaf area index (Le) and canopy cover. A trial camera monitoring network (CrowNet) was established encompassing 20 forest stands in Italy, under different management and environmental conditions, resulting in over 44,000 daily images collected over three years. We demonstrated that taking the mean daily canopy attribute allowed to obtain smooth time series from trail cameras, from which phenological transition dates can be inferred. Daily canopy attributes were validated against manual digital cover photography measurement. To further explore the applicability of this monitoring solution, we performed a comparison between daily Le time series derived from a subset of trail cameras located in beech forests and data collected by multitemporal UAV LiDAR. Results demonstrated the close agreement between the two methods across the entire phenological period (start and end of season). We also illustrated use of continuous trail camera estimates to calibrate a vegetation index (NDVI) to infer leaf area and canopy cover from optical multi-temporal UAV data. We further investigated use of trail camera to detect species-specific differences in tree phenology from time series acquired in a mixed oak-hornbeam forest. We found different canopy structure and phenological transition dates in three broadleaved species (oak, ash, hornbeam), supporting the effectiveness of trail cameras for species-oriented phenology monitoring. We conclude that trail cameras provide a reliable solution for daily canopy monitoring, offering a significant cost-effective and flexible alternative to traditional field methods and providing potential to calibrate, validate or integrate remotely-sensed information. However, camera failures during adverse weather, and the need for more efficient image data quality checking procedures, still represent open challenges. Future improvements, such as weatherproof housing and automated pre-processing screening procedures, are therefore recommended for making trail camera fully operational in ground canopy and phenology monitoring. © 2025 Elsevier B.V.

Improving Aboveground Biomass Estimation in Beech Forests with 3D Tree Crown Parameters Derived from UAV-LS
Mostra abstract
Accurate estimates of aboveground biomass (AGB) are essential for forest policies to reduce carbon emissions. Unmanned aerial laser scanning (UAV-LS) offers unprecedented millimetric detail but is underutilized in monitoring broadleaf Mediterranean forests compared to coniferous ones. This study aims to design and evaluate a procedure for AGB estimates based on the predictive power of crown features. In the first step, we manually created Quantitative Structure Models (QSMs) for 320 trees using data from UAV laser scanning (UAV-LS), airborne laser scanning (ALS), and co-registered terrestrial laser scanning (TLS). This provided the most accurate non-destructive estimate of aboveground biomass (AGB) in the absence of destructive measurements. For each reference tree we also measured crown projection and crown volume to build two separated models relating AGB to such crown features. In the second phase, we evaluated the potential of UAV-LS for quantifying AGB in a pure European beech (Fagus sylvatica) forest and compared it with traditional ALS estimates, using fully automatic procedures. The two obtained tree-level AGB models were then tested using three datasets derived from 35 sampling plots over the same study area: (a) 1130 trees manually segmented (phase-2 reference); (b) trees automatically extracted from ALS data; and (c) trees automatically extracted from UAV-LS data. Results demonstrate that detailed UAV-LS data improve model sensitivity compared to ALS data (RMSE = 45.6 Mg ha<sup>−1</sup>, RMSE% = 13.4%, R2 = 0.65, for the best ALS model; RMSE = 44.0 Mg ha<sup>−1</sup>, RMSE% = 12.9%, R2 = 0.67, for the best UAV-LS model), allowing for the detection of AGB differences even in quite homogenous forest structures. Overall, this study demonstrates the combined use of both laser scanner data can foster non-destructive and more precise AGB estimation than the use of only one, in forested areas across hectare scales (1 to 100 ha). © 2025 by the authors.
Benchmarking tree species classification from proximally sensed laser scanning data: Introducing the FOR-species20K dataset
Puliti
,
Stefano
,
Lines
,
Emily R.
,
Müllerová
,
Jana
,
Frey
,
Julian
,
Schindler
,
Zoe
,
Straker
,
Adrian
,
Allen
,
Matthew J.
,
Winiwarter
,
Lukas
,
Rehush
,
Nataliia
,
Hristova
,
Hristina S.
,
Murray
,
Brent A.
,
Calders
,
Kim
,
Coops
,
Nicholas C.
,
Höfle
,
Bernhard
,
Irwin
,
Liam A.K.
,
Junttila
,
Samuli
,
Kruček
,
Martin
,
Krok
,
G.
,
Král
,
Kamil
,
Levick
,
Shaun R.
,
Lück
,
Linda
,
Missarov
,
Azim
,
Mokroš
,
M.
,
Owen
,
Harry Jon Foord
,
Stereńczak
,
Krzysztof Jan
,
Pitkänen
,
Timo P.
,
Puletti
,
Nicola
,
Saarinen
,
Ninni
,
Hopkinson
,
Chris Dennis
,
Terryn
,
Louise
,
Torresan
,
C.
,
Tomelleri
,
Enrico
,
Weiser
,
Hannah
,
Astrup
,
Rasmus
Mostra abstract
Proximally sensed laser scanning presents new opportunities for automated forest ecosystem data capture. However, a gap remains in deriving ecologically pertinent information, such as tree species, without additional ground data. Artificial intelligence approaches, particularly deep learning (DL), have shown promise towards automation. Progress has been limited by the lack of large, diverse, and, most importantly, openly available labelled single-tree point cloud datasets. This has hindered both (1) the robustness of the DL models across varying data types (platforms and sensors) and (2) the ability to effectively track progress, thereby slowing the convergence towards best practice for species classification. To address the above limitations, we compiled the FOR-species20K benchmark dataset, consisting of individual tree point clouds captured using proximally sensed laser scanning data from terrestrial (TLS), mobile (MLS) and drone laser scanning (ULS). Compiled collaboratively, the dataset includes data collected in forests mainly across Europe, covering Mediterranean, temperate and boreal biogeographic regions. It includes scattered tree data from other continents, totaling over 20,000 trees of 33 species and covering a wide range of tree sizes and forms. Alongside the release of FOR-species20K, we benchmarked seven leading DL models for individual tree species classification, including both point cloud (PointNet++, MinkNet, MLP-Mixer, DGCNNs) and multi-view 2D-based methods (SimpleView, DetailView, YOLOv5). 2D Image-based models had, on average, higher overall accuracy (0.77) than 3D point cloud-based models (0.72). Notably, the performance was consistently >0.8 across scanning platforms and sensors, offering versatility in deployment. The top-scoring model, DetailView, demonstrated robustness to training data imbalances and effectively generalized across tree sizes. The FOR-species20K dataset represents an important asset for developing and benchmarking DL models for individual tree species classification using proximally sensed laser scanning data. As such, it serves as a crucial foundation for future efforts to classify accurately and map tree species at various scales using laser scanning technology, as it provides the complete code base, dataset, and an initial baseline representative of the current state-of-the-art of point cloud tree species classification methods. © 2025 The Author(s). Methods in Ecology and Evolution published by John Wiley & Sons Ltd on behalf of British Ecological Society.