Loading...
Pubblicazioni Scientifiche
Filtri di ricerca 3 risultati
Pubblicazioni per anno
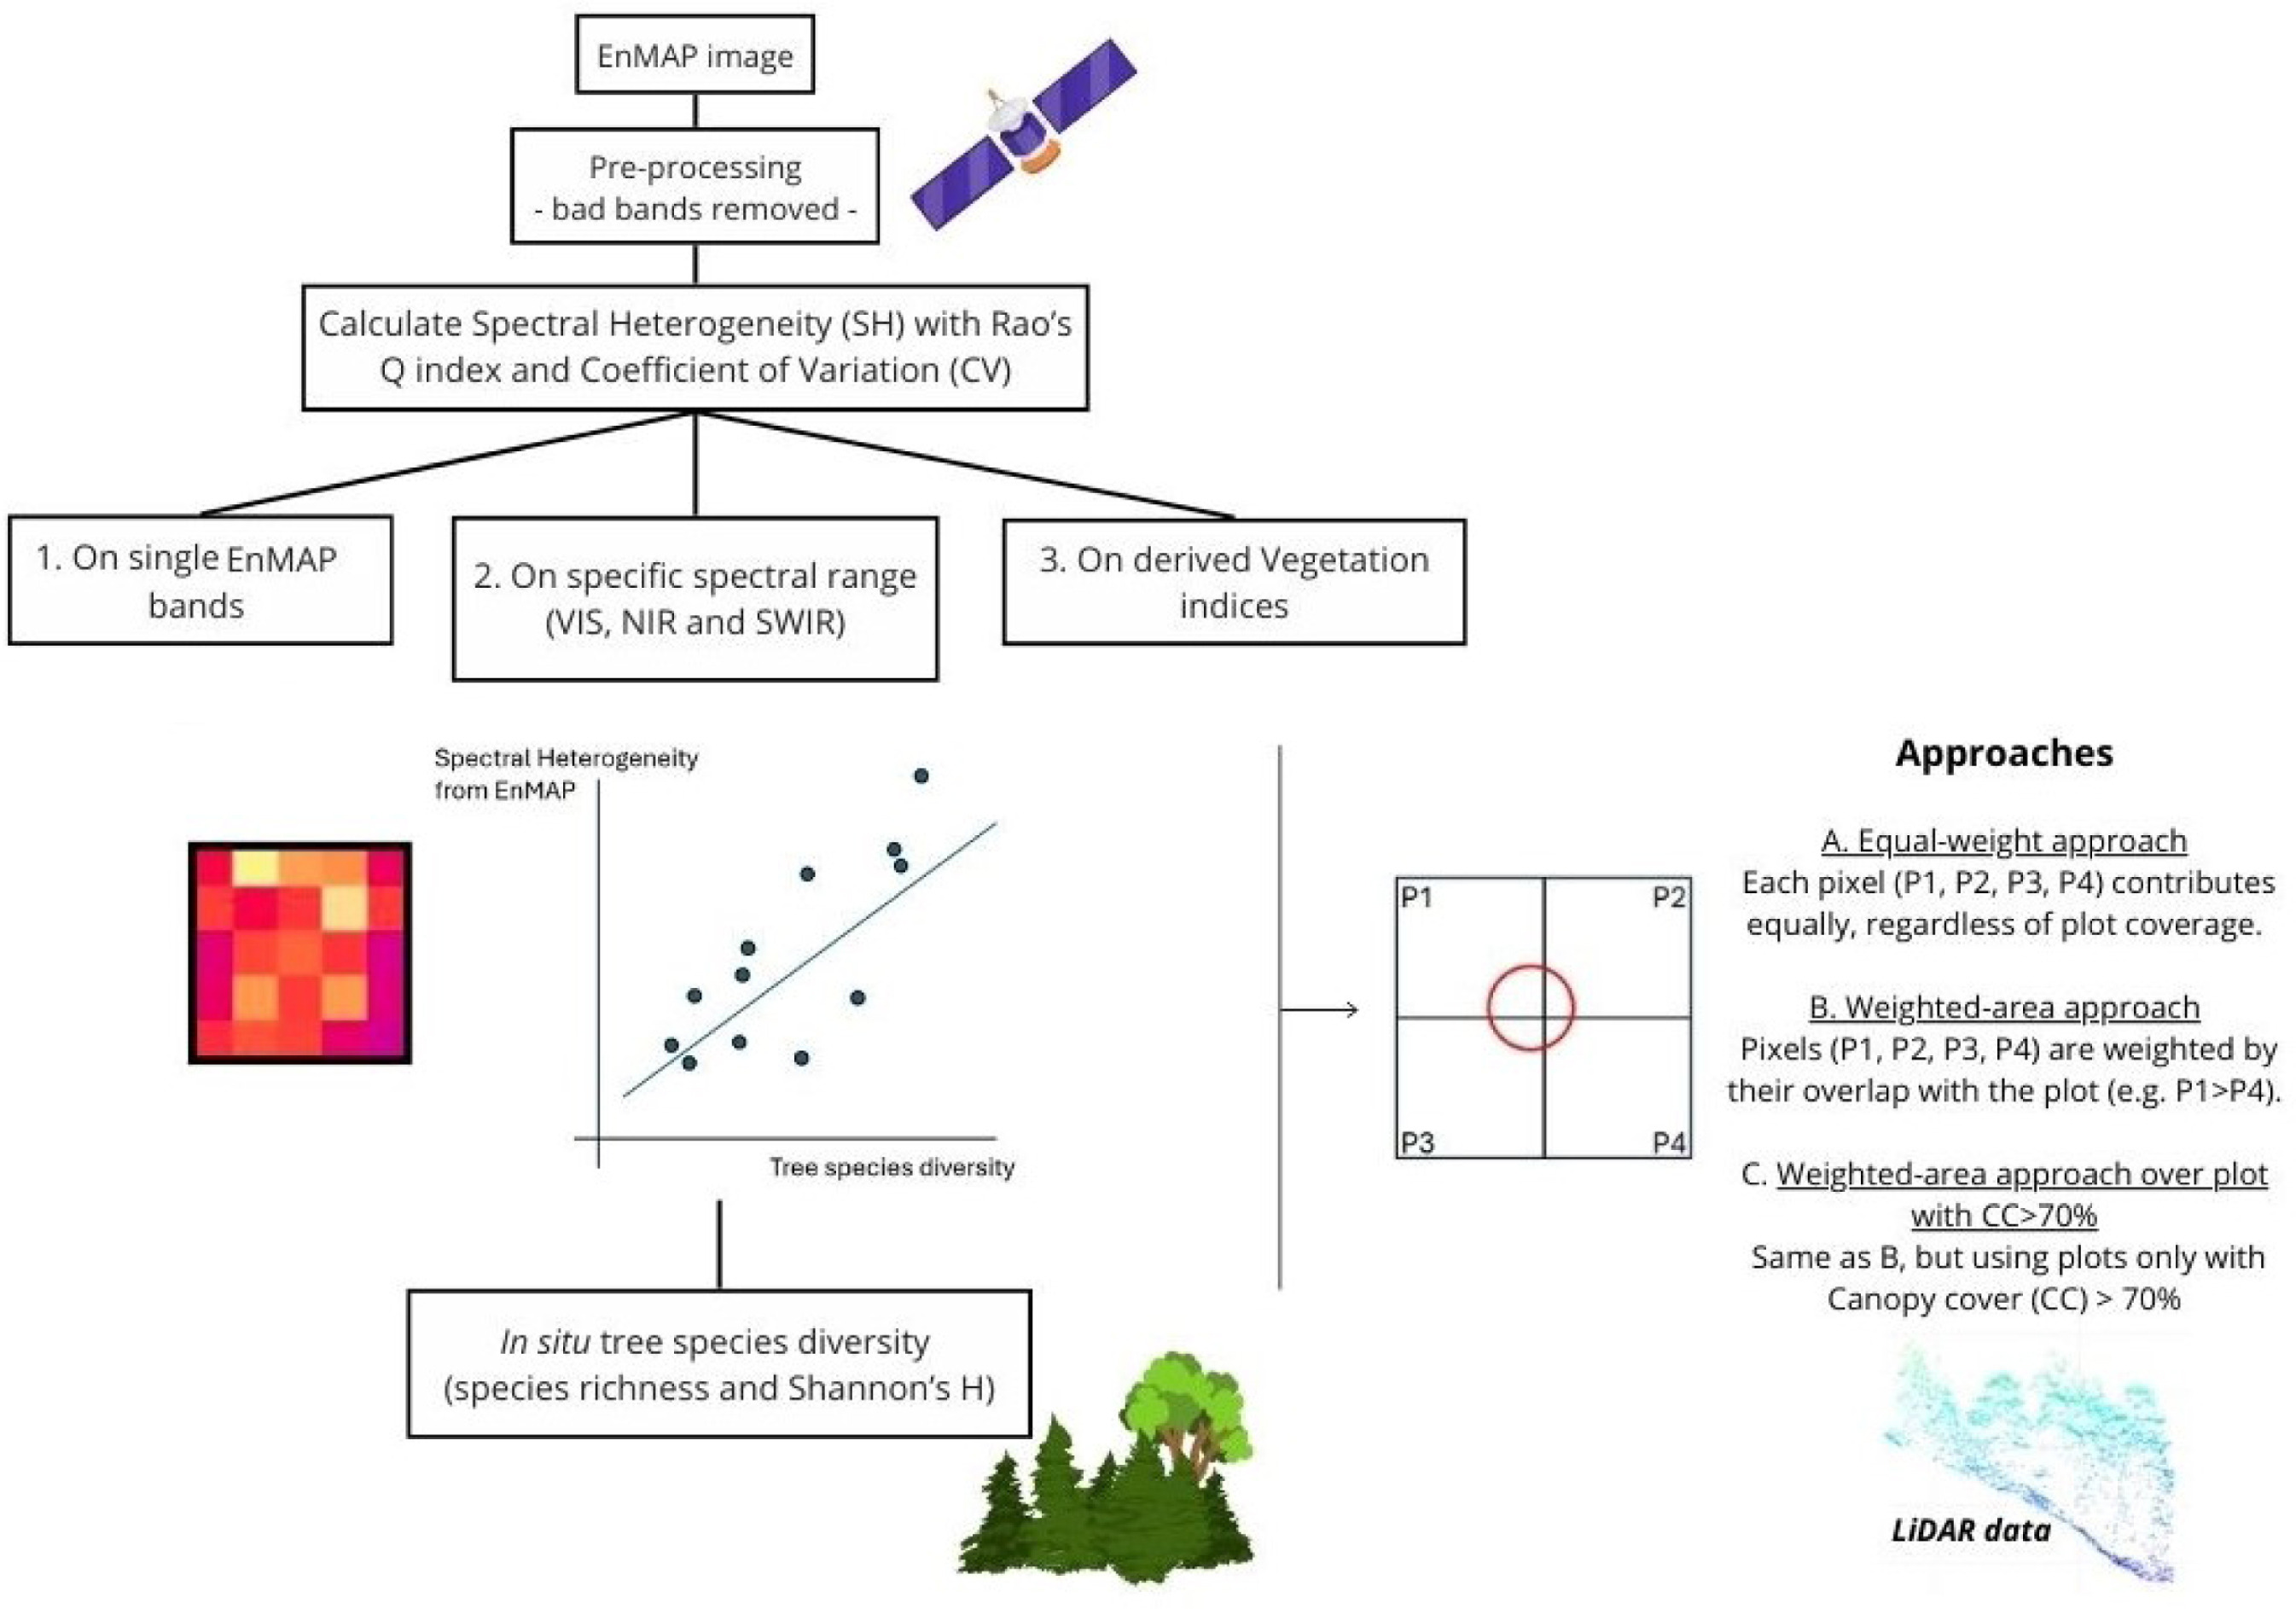
Spectral heterogeneity from the spaceborne imaging spectrometer EnMAP reveals biodiversity patterns in forest ecosystems
Torresani
,
Michele
,
Rossi
,
Christian
,
Mina
,
Marco
,
Menegaldo
,
Irene
,
Cappuccio
,
Matteo
,
Perrone
,
Michela
,
Hakkenberg
,
Christopher R.
,
Rocchini
,
Duccio
,
Puletti
,
Nicola
,
Stendardi
,
Laura
,
Montagnani
,
Leonardo
,
Tognetti
,
Roberto
Mostra abstract
The Spectral Variation Hypothesis (SVH) proposes that spectral heterogeneity (SH), derived from optical data, can serve as a proxy for estimating biodiversity. In this study, we tested the SVH across 42 forest plots in the Italian Alps using imaging spectroscopy data from the EnMAP satellite. We investigated the relationship between SH—quantified using two different metrics, Rao's Q and the coefficient of variation (CV)—and tree species diversity (using Shannon's H index and species richness). We applied three levels of spectral analysis: (1) SH calculated for each individual EnMAP band; (2) SH aggregated across broader spectral ranges (Visible -VIS-, Near Infrared -NIR-, and Shortwave Infrared -SWIR-) and (3) SH derived from vegetation indices (VIs). These analyses were performed under three spatial approaches: (A) a normal approach assigning equal weight to all four EnMAP pixels intersecting a plot; (B) a weighted approach based on the proportional overlap of each pixel with the plot area; and (C) a weighted canopy cover (CC)>70% approach, which included only plots with CC greater than 70% as derived from airborne laser scanning (ALS) LiDAR data. Weak to moderate correlations were observed when SH was derived from single bands, with the strongest relationships in the NIR (R<sup>2</sup> approaching 0.4), followed by the VIS and SWIR regions. A similar trend emerged when SH was aggregated across broader spectral ranges, with the highest correlations again found in the NIR (R<sup>2</sup> up to 0.35). In contrast, lower R<sup>2</sup> values were obtained when SH was computed from specific VIs. The weighted approaches, especially when restricted to plots with CC >70%, consistently yielded higher R<sup>2</sup> values than the equal-weight approach in all three the spectral analysis. Results were consistent across both SH metrics (Rao's Q and CV), with stronger correlations when species richness was used as the biodiversity metric. This work highlights how EnMAP hyperspectral data, despite inherent constraints, can provide valuable insights into forest biodiversity monitoring. © 2025 The Author(s)
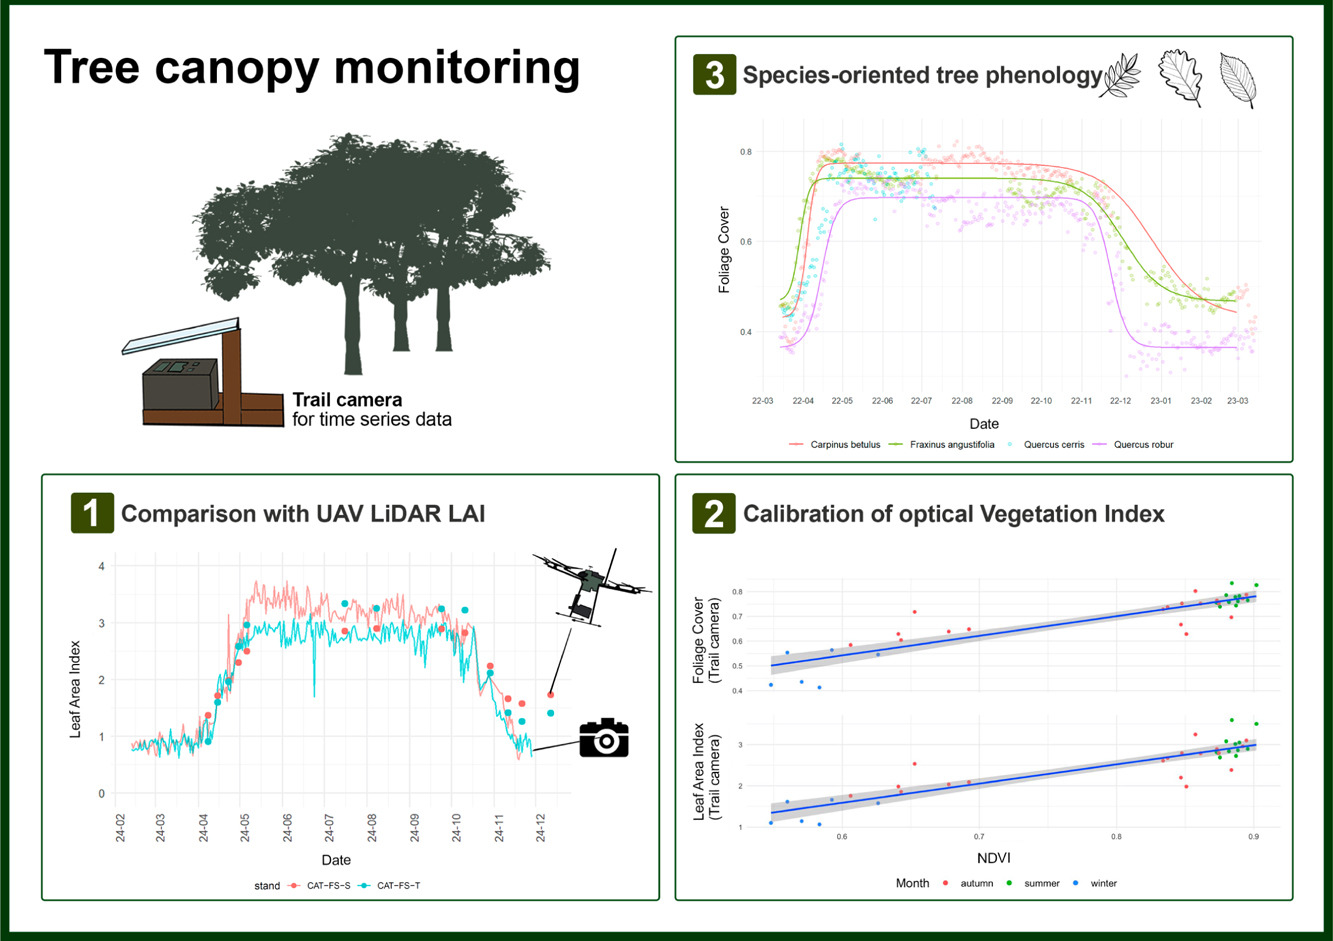
CrowNet: a trail-camera canopy monitoring system
Chianucci
,
Francesco
,
Lenzi
,
Alice
,
Minari
,
Emma
,
Guasti
,
Matteo
,
Gisondi
,
Silvia
,
Gonnelli
,
Marco
,
Innocenti
,
Simone
,
Ferrara
,
Carlotta
,
Campanaro
,
Alessandro
,
Ciampelli
,
Paola
,
Cutini
,
Andrea
,
Puletti
,
Nicola
Mostra abstract
Continuous monitoring of forest canopy structure and phenology is pivotal for the assessment of ecosystem responses to environmental variability and changes. The present study evaluated the use of repeat digital trail cameras as a low-cost, flexible, and accessible in situ monitoring solution for quantifying daily canopy attributes, including effective leaf area index (Le) and canopy cover. A trial camera monitoring network (CrowNet) was established encompassing 20 forest stands in Italy, under different management and environmental conditions, resulting in over 44,000 daily images collected over three years. We demonstrated that taking the mean daily canopy attribute allowed to obtain smooth time series from trail cameras, from which phenological transition dates can be inferred. Daily canopy attributes were validated against manual digital cover photography measurement. To further explore the applicability of this monitoring solution, we performed a comparison between daily Le time series derived from a subset of trail cameras located in beech forests and data collected by multitemporal UAV LiDAR. Results demonstrated the close agreement between the two methods across the entire phenological period (start and end of season). We also illustrated use of continuous trail camera estimates to calibrate a vegetation index (NDVI) to infer leaf area and canopy cover from optical multi-temporal UAV data. We further investigated use of trail camera to detect species-specific differences in tree phenology from time series acquired in a mixed oak-hornbeam forest. We found different canopy structure and phenological transition dates in three broadleaved species (oak, ash, hornbeam), supporting the effectiveness of trail cameras for species-oriented phenology monitoring. We conclude that trail cameras provide a reliable solution for daily canopy monitoring, offering a significant cost-effective and flexible alternative to traditional field methods and providing potential to calibrate, validate or integrate remotely-sensed information. However, camera failures during adverse weather, and the need for more efficient image data quality checking procedures, still represent open challenges. Future improvements, such as weatherproof housing and automated pre-processing screening procedures, are therefore recommended for making trail camera fully operational in ground canopy and phenology monitoring. © 2025 Elsevier B.V.

Reliability of canopy photography for forest ecology and biodiversity studies
von Meijenfeldt
,
Anouk
,
Chianucci
,
Francesco
,
Rigo
,
Francesca
,
Ottenburghs
,
Jente
,
Hilpold
,
Andreas
,
Mina
,
Marco
leaf area index
canopy photography
canopy structure
hemispherical photography
mountain forests
understory vegetation
Mostra abstract
Understory is a key component of forest biodiversity. The structure of the forest stand and the horizontal composition of the canopy play a major role on the light regime of the understory, which in turn affects the abundance and the diversity of the understory plant community. Reliable assessments of canopy structural attributes are essential for forest research and biodiversity monitoring programs, as well as to study the relationship between canopy and understory plant communities. Canopy photography is a widely used method but it is still not clear which photographic techniques is better suited to capture canopy attributes at stand-level that can be relevant in forest biodiversity studies. For this purpose, we collected canopy structure and understory plant diversity data on 51 forest sites in the north-eastern Italian Alps, encompassing a diversity of forest types from low-elevation deciduous, to mixed montane stands to subalpine coniferous forests. Canopy images were acquired using both digital cover (DCP) and hemispherical (DHP) photography, and analysed canopy structural attributes. These attributes were then compared to tree species composition data to evaluate whether they were appropriate to differentiate between forest types. Additionally, we tested what canopy attributes derived from DCP and DHP best explained the species composition of vascular plants growing in the understory. We found that hemispherical canopy photography was most suitable to capture differences in forest types, which was best expressed by variables such as leaf inclination angle and canopy openness. On our sites, DHP-based canopy attributes were also able to better distinguish between different conifer forests. Leaf clumping was the most important attribute for determining plant species distribution of the understory, indicating that diverse gap structures create different microclimate conditions enhancing diverse plant species with different ecological strategies. This study supports the reliability of canopy photography to derive meaningful indicators in forest and biodiversity research, but also provide insights for increasing understory diversity in managed forests of high conservation value. © 2025